

In short
Sales shows your Amazon orders, fees, ads and profit for any day or month, and guesses how the whole month will end. It counts each sale on the day the buyer ordered it. Say Tonies Sleepy Friends sold 5 this month. On the Month to date tile, its product row shows $150.00 of sales and $9.10 of net profit. The est. mark means Amazon hasn’t paid out every one of those orders yet. Click Sales on the bar. For one made-up month walked through every figure, see Step by step below.
Tonies Sleepy Friends on Sales, Month to date on the seed day (Oct 1-30). Notice 5 units sold and $9.10 of net profit.
More details
A quick example
A quick example
The tiles
The tiles
How each number is worked out
How each number is worked out
- Orders: Amazon orders placed in this period. An order with two products counts once.
- Units: units buyers ordered in this period. Cancelled units are left out.
- Sales: what buyers paid. Once Amazon pays an order, it’s Amazon’s paid-out amount. Before that, it’s the order price.
- Refunds: refunds Amazon paid back in this period, by refund date, less the fees Amazon gave back. Units sent back in good shape add their cost back.
- Ad spend: Amazon gives one ad total per product per month. SourceDock spreads it evenly over the month’s days.
- Amazon fees: Amazon’s fees for these orders, plus inbound, storage, removal, and disposal fees, less what Amazon paid you for lost or damaged units.
- COGS (cost of goods sold): what the sold units cost you, from your purchases. Units with no cost are left out, never counted as $0.
- Gross profit: sales less promo, ad spend, refunds, Amazon fees, and cost of goods.
- Net profit: gross profit less the costs you added on the Expenses page.
- Margin: net profit divided by sales. Buyers pay $20 and you keep $5: that’s 25%.
- ROI: net profit divided by cost of goods.
The forecast
This month adds your full days so far to their daily average for each day left. Today is left out of the average. Before the month has 2 full days, it uses last month’s daily average.The chart and the products
The chart and the products
Stores
Stores
How often it updates
How often it updates
Plans
Plans
Step by step
About this walk-through
About this walk-through
- Uno card game: 12 bought at $8.00 each. It sells for $20.00. Its last sale was the day before the seed day.
- YETI Rambler mug: 10 bought at $16.00 each. It sells for $40.00. Its last sale was also the day before the seed day, and 2 went to Canada from US stock, 42 and 21 days before the seed day.
What one full day holds
What one full day holds
- Refunded amount -$20.00. Amazon gave the buyer the $20 back.
- Refund commission -$1.00. Amazon keeps this fee on the refund.
- Refunded referral fee $3.00. Amazon gives the $3 referral fee back.
- Value of returned items $8.00. The unit is back in stock, so its cost comes back.
The page around the tiles
The page around the tiles

Whole demo US store: the top of the Sales page on the seed day. Notice Last sync and Next sync under the title, and Custom with two day boxes above the tiles.
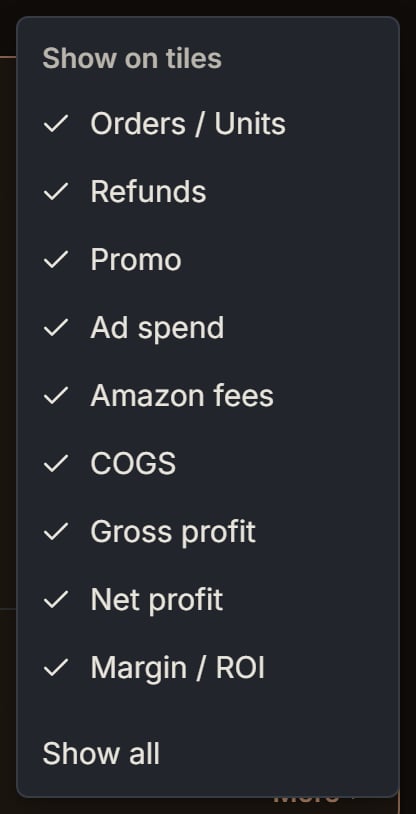
Whole demo US store: the ⋯ menu above the tiles. Notice every line starts ticked, and Show all sits at the bottom.
Month to date
Month to date
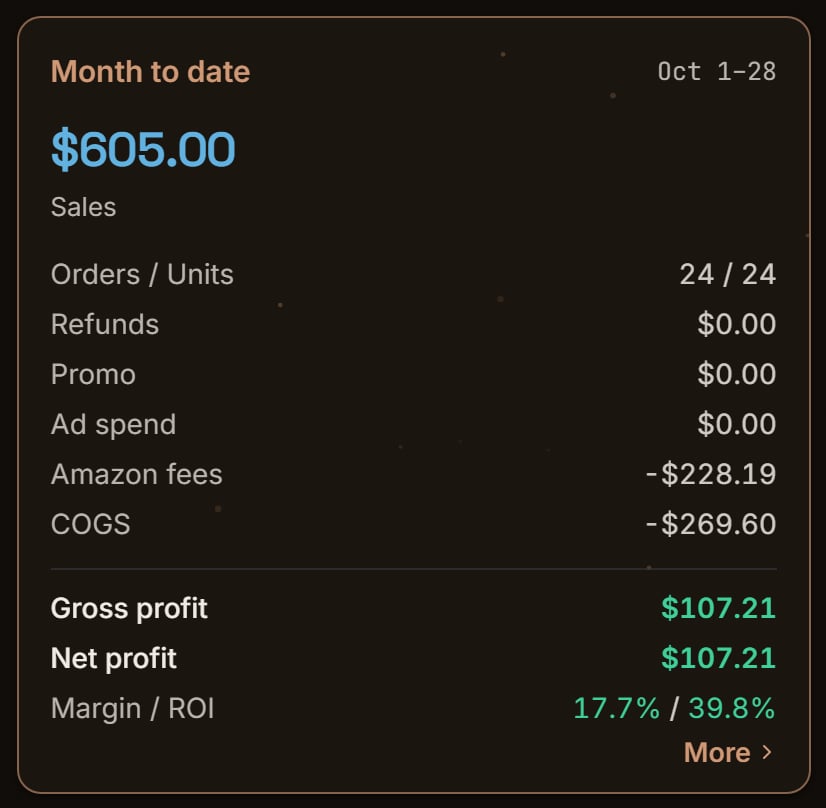
Whole demo US store: the Month to date tile on the seed day. Notice the dates read Oct 1–28, the 1st of the month through the seed day.
- Expenses recorded by you -$8.00. The hover names Boxes and tape $8.00.
- Estimated payout $180.00.
- TACOS 1.0% est.
- % Refunds 15.0%.
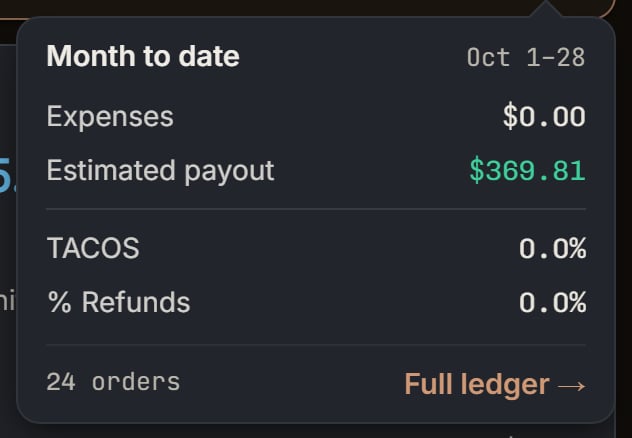
Whole demo US store: More, opened on the Month to date tile. Notice the foot: 24 orders, then Full ledger →.
The other tiles on October 4
The other tiles on October 4
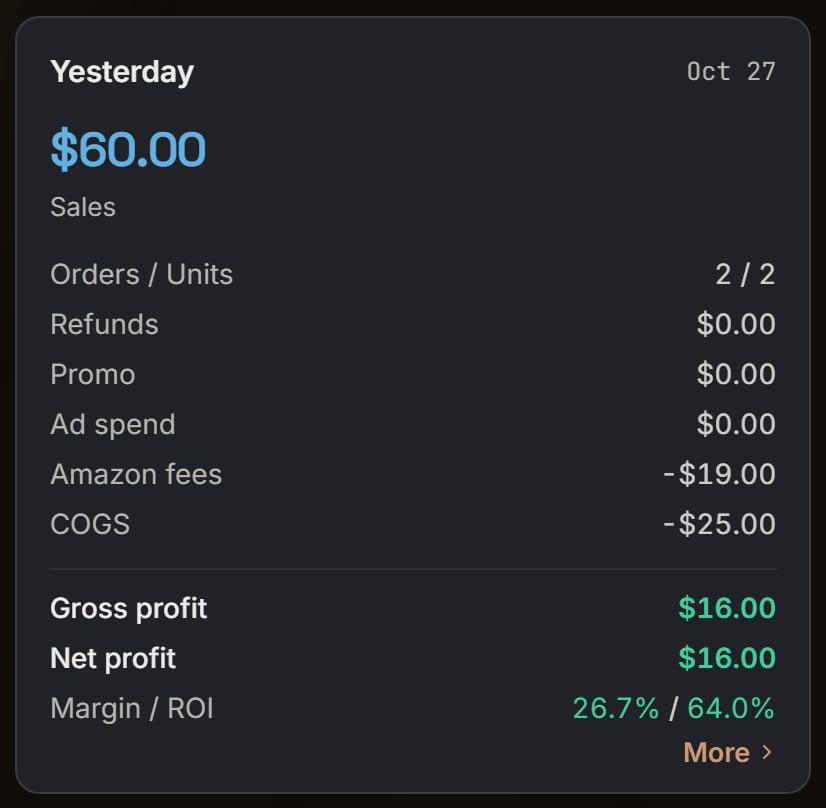
Uno card game and YETI mug: the demo store's Yesterday tile, the day before the seed day. Notice Sales $60.00 and Orders / Units 2 / 2: one Uno at $20.00 and one mug at $40.00.
How this month's forecast is built
How this month's forecast is built
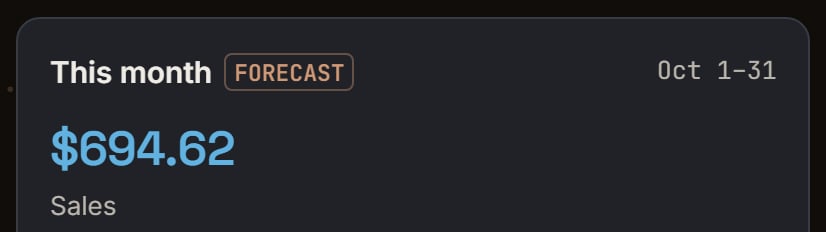
Whole demo US store: the top of the This month tile. Notice the Forecast badge and the dates Oct 1–31, the whole month.
Start from the full days
Add the daily average for each day left
Do that for every other line
Add up profit, then take off real expenses
The chart
The chart
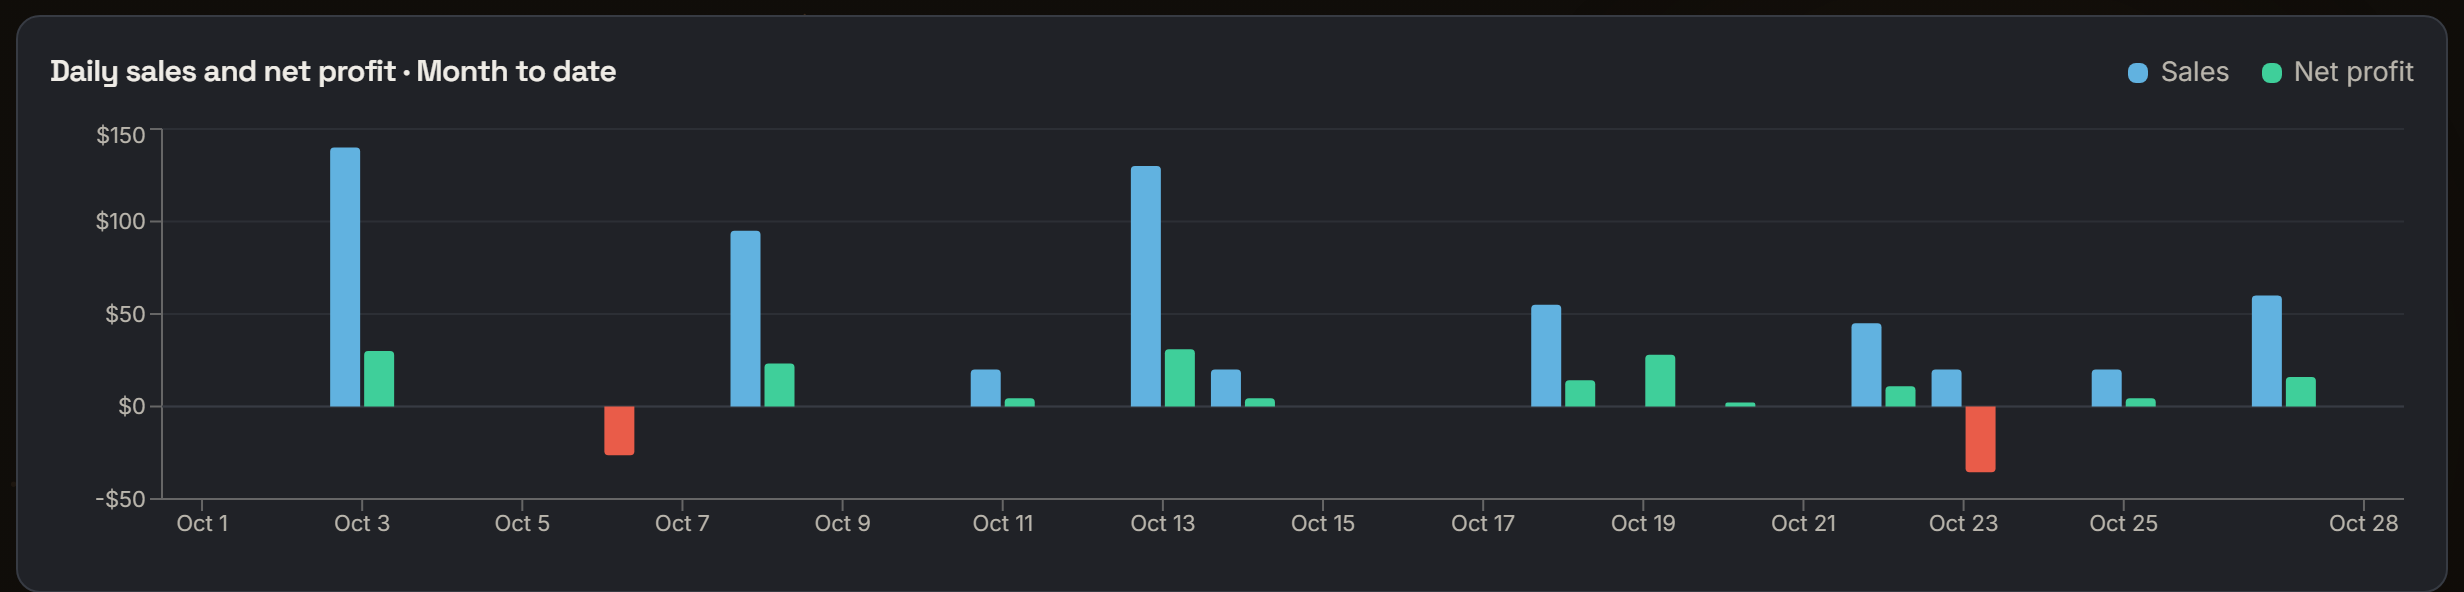
Whole demo US store: the chart on Month to date. Notice one pair of bars a day, with a red bar on days when net profit was below $0.
The product table
The product table

Uno card game: the product table on Month to date, searched for B01MG6C6K9. Notice Units Sold 3 and Sales $60.00, which is 3 × $20.00.
The full ledger
The full ledger
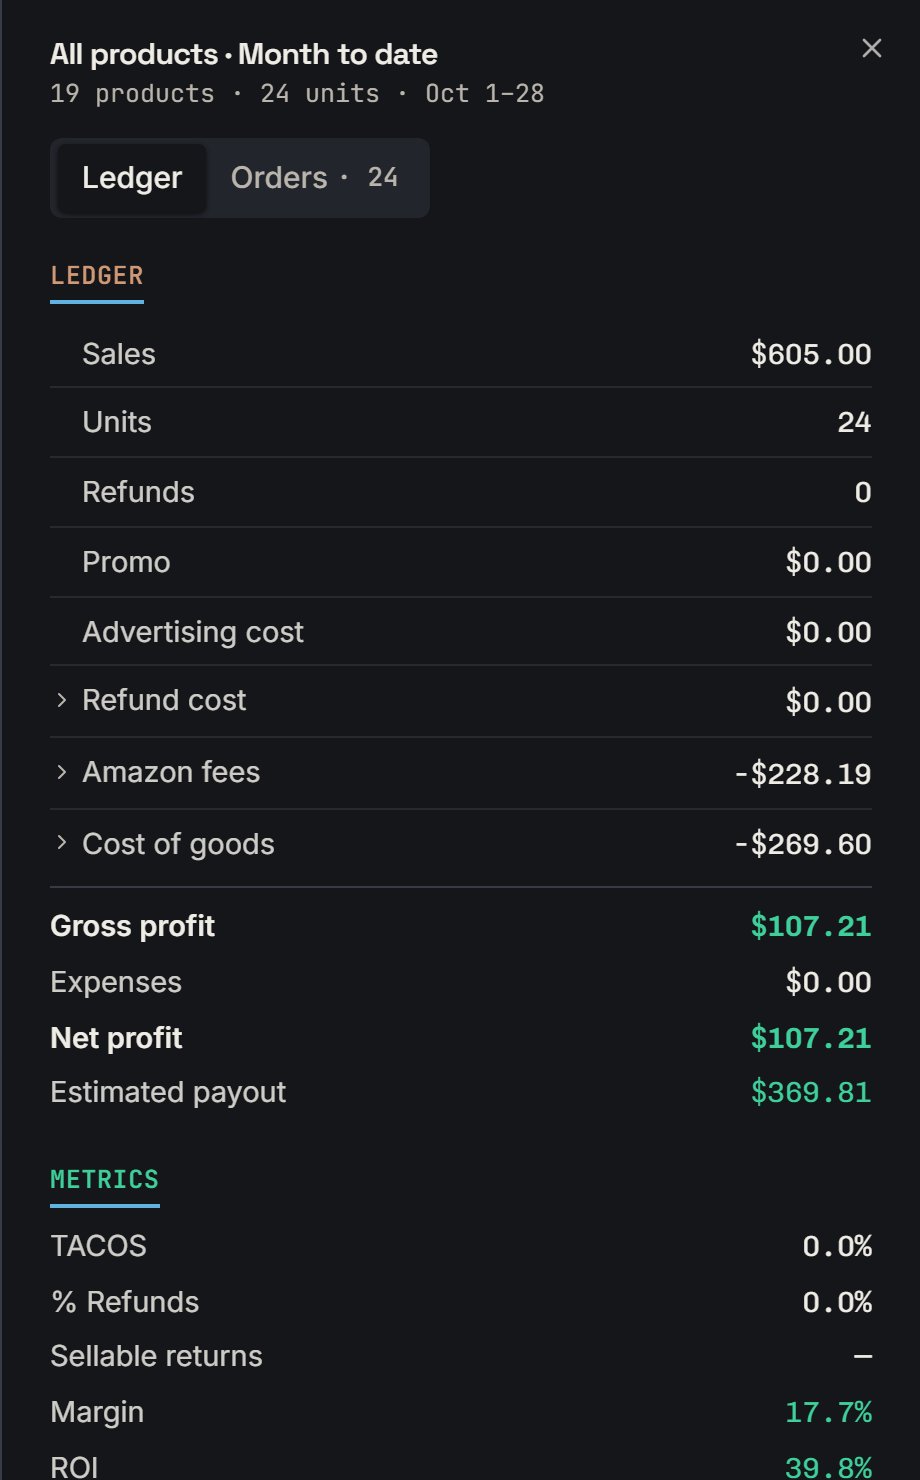
Whole demo US store: the full ledger for Month to date. Notice the two tabs, Ledger and Orders · 24, and the Metrics list under the ledger.
- Sales $400.00
- Units 20
- Refunds 3
- Promo -$6.00
- Advertising cost -$4.00 est.
- Refund cost -$30.00
- Amazon fees -$160.00
- Cost of goods -$160.00
- Gross profit $40.00 est.
- Expenses recorded by you -$8.00
- Net profit $32.00 est.
- Estimated payout $180.00
- Refunded amount -$60.00. That is 3 × -$20.
- Refund commission -$3.00. That is 3 × -$1.
- Refunded referral fee $9.00. That is 3 × $3.
- Value of returned items $24.00. That is 3 × $8.
- FBA per unit fulfilment fee -$100.00. That is 20 × -$5.
- Referral fee -$60.00. That is 20 × -$3.
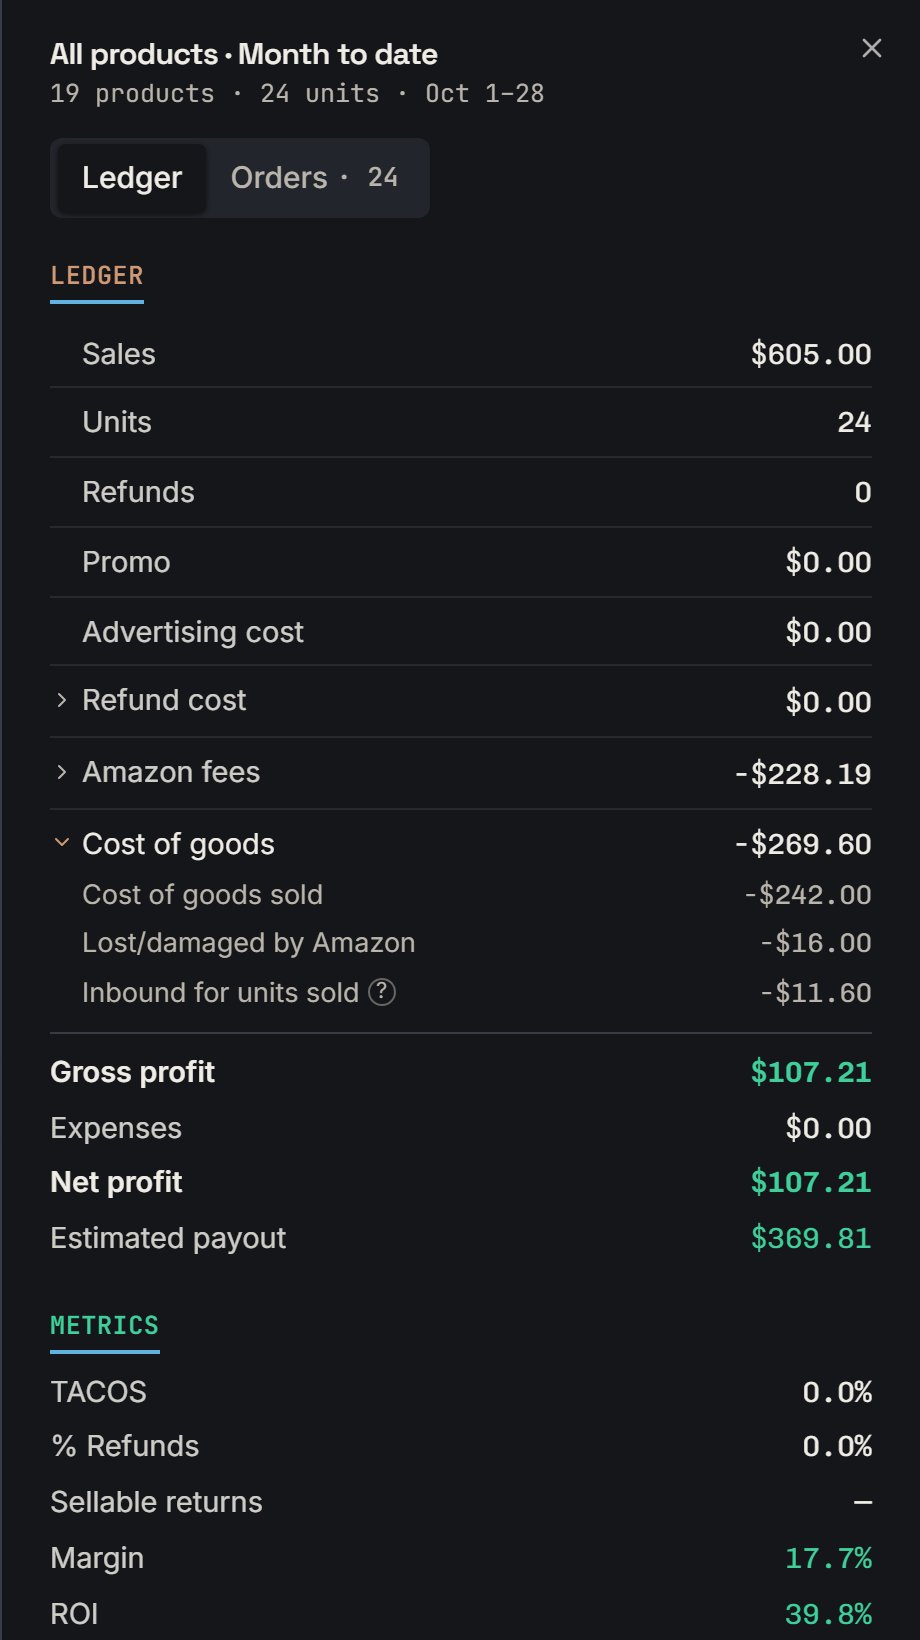
Whole demo US store: Cost of goods, opened in the ledger. Notice the three lines under it add up: $242.00 + $16.00 + $11.60 = $269.60.
- TACOS 1.0% est.
- % Refunds 15.0%
- Sellable returns 100.0%. All 3 returned units were sellable. 3 / 3 = 100.0%.
- Margin 8.0%
- ROI 20.0%
- Sessions is a dash. So is Unit session percentage. Amazon does not give SourceDock sessions for a period.
A Canada store, US stock, and All stores
A Canada store, US stock, and All stores
Marks that change how a number looks
Marks that change how a number looks