

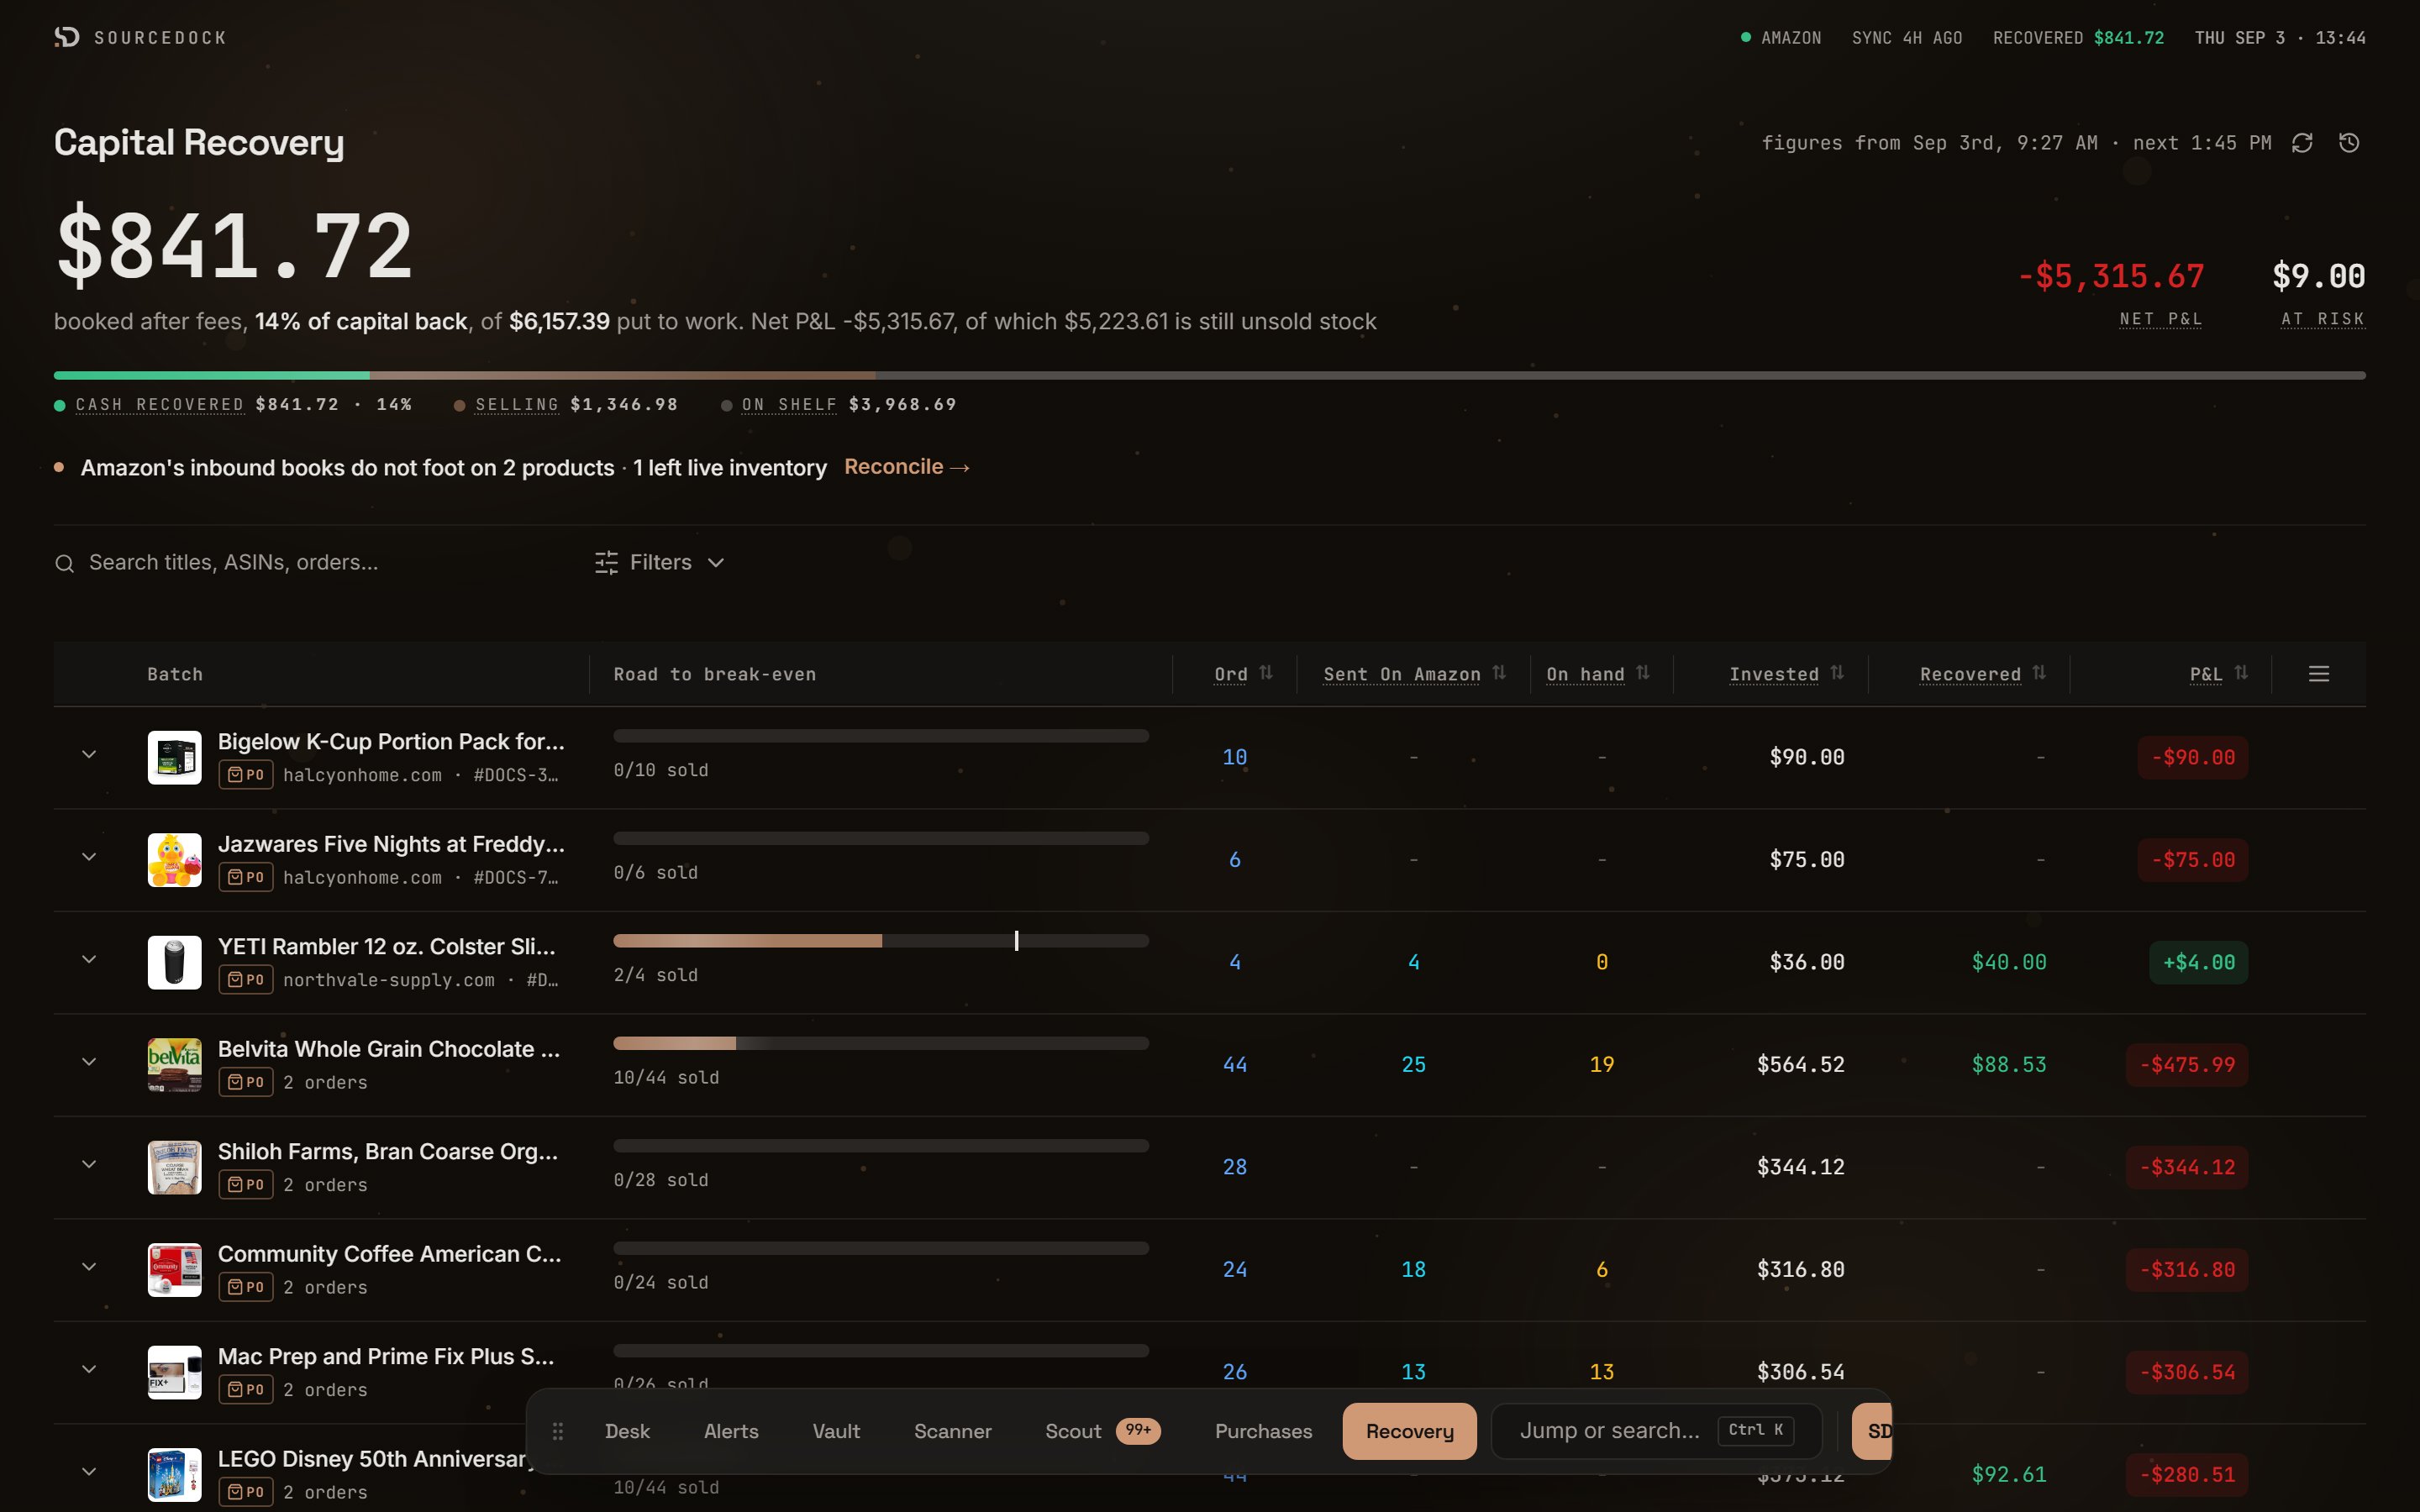
The Capital Recovery desk
The header
The big number is recovered. That is the cash Amazon has booked for you after fees, plus reimbursements. It is not profit. The line under it says what percent of your capital is back, and how much you put to work. It also shows Net P&L and how much of that is still unsold stock.
Under the figures is a thin bar with three bands. Hover any label to read what it means.

The header figures and the split bar
Sync stamp, refresh, and rebuild
The top right shows “figures from” a date and time. While a sync runs it says “updating”. It may also show when the next scheduled sync is due. If the last sync failed, or is more than 7 days old, a retry sync link appears.
While a sync runs, a progress line shows the phase and step count. A sync pulls fee analytics, settlement reports, sales and fees, inventory changes, customer returns, and reimbursements. Then it checks each batch and adds up the totals again. It can take several minutes.
The table
Each row is one product across all its batches. Click a header to sort. Hover a header to read its meaning.
Simple is the default density. Advanced adds two Amazon columns. Marked Sent is units on orders you marked Sent to FBA, minus write-offs. Amazon Received is what Amazon counted at the dock. You can also turn on Amazon holds: every unit that has gone through Amazon. That counts live stock plus units already sold, lost, or damaged.
Filters
The search box finds titles, ASINs, and orders. Open the filter panel for more.
When you click through from the At risk figure, an Unreimbursed only chip appears. Click its X to clear it.
Expand a row
Click a row to open it.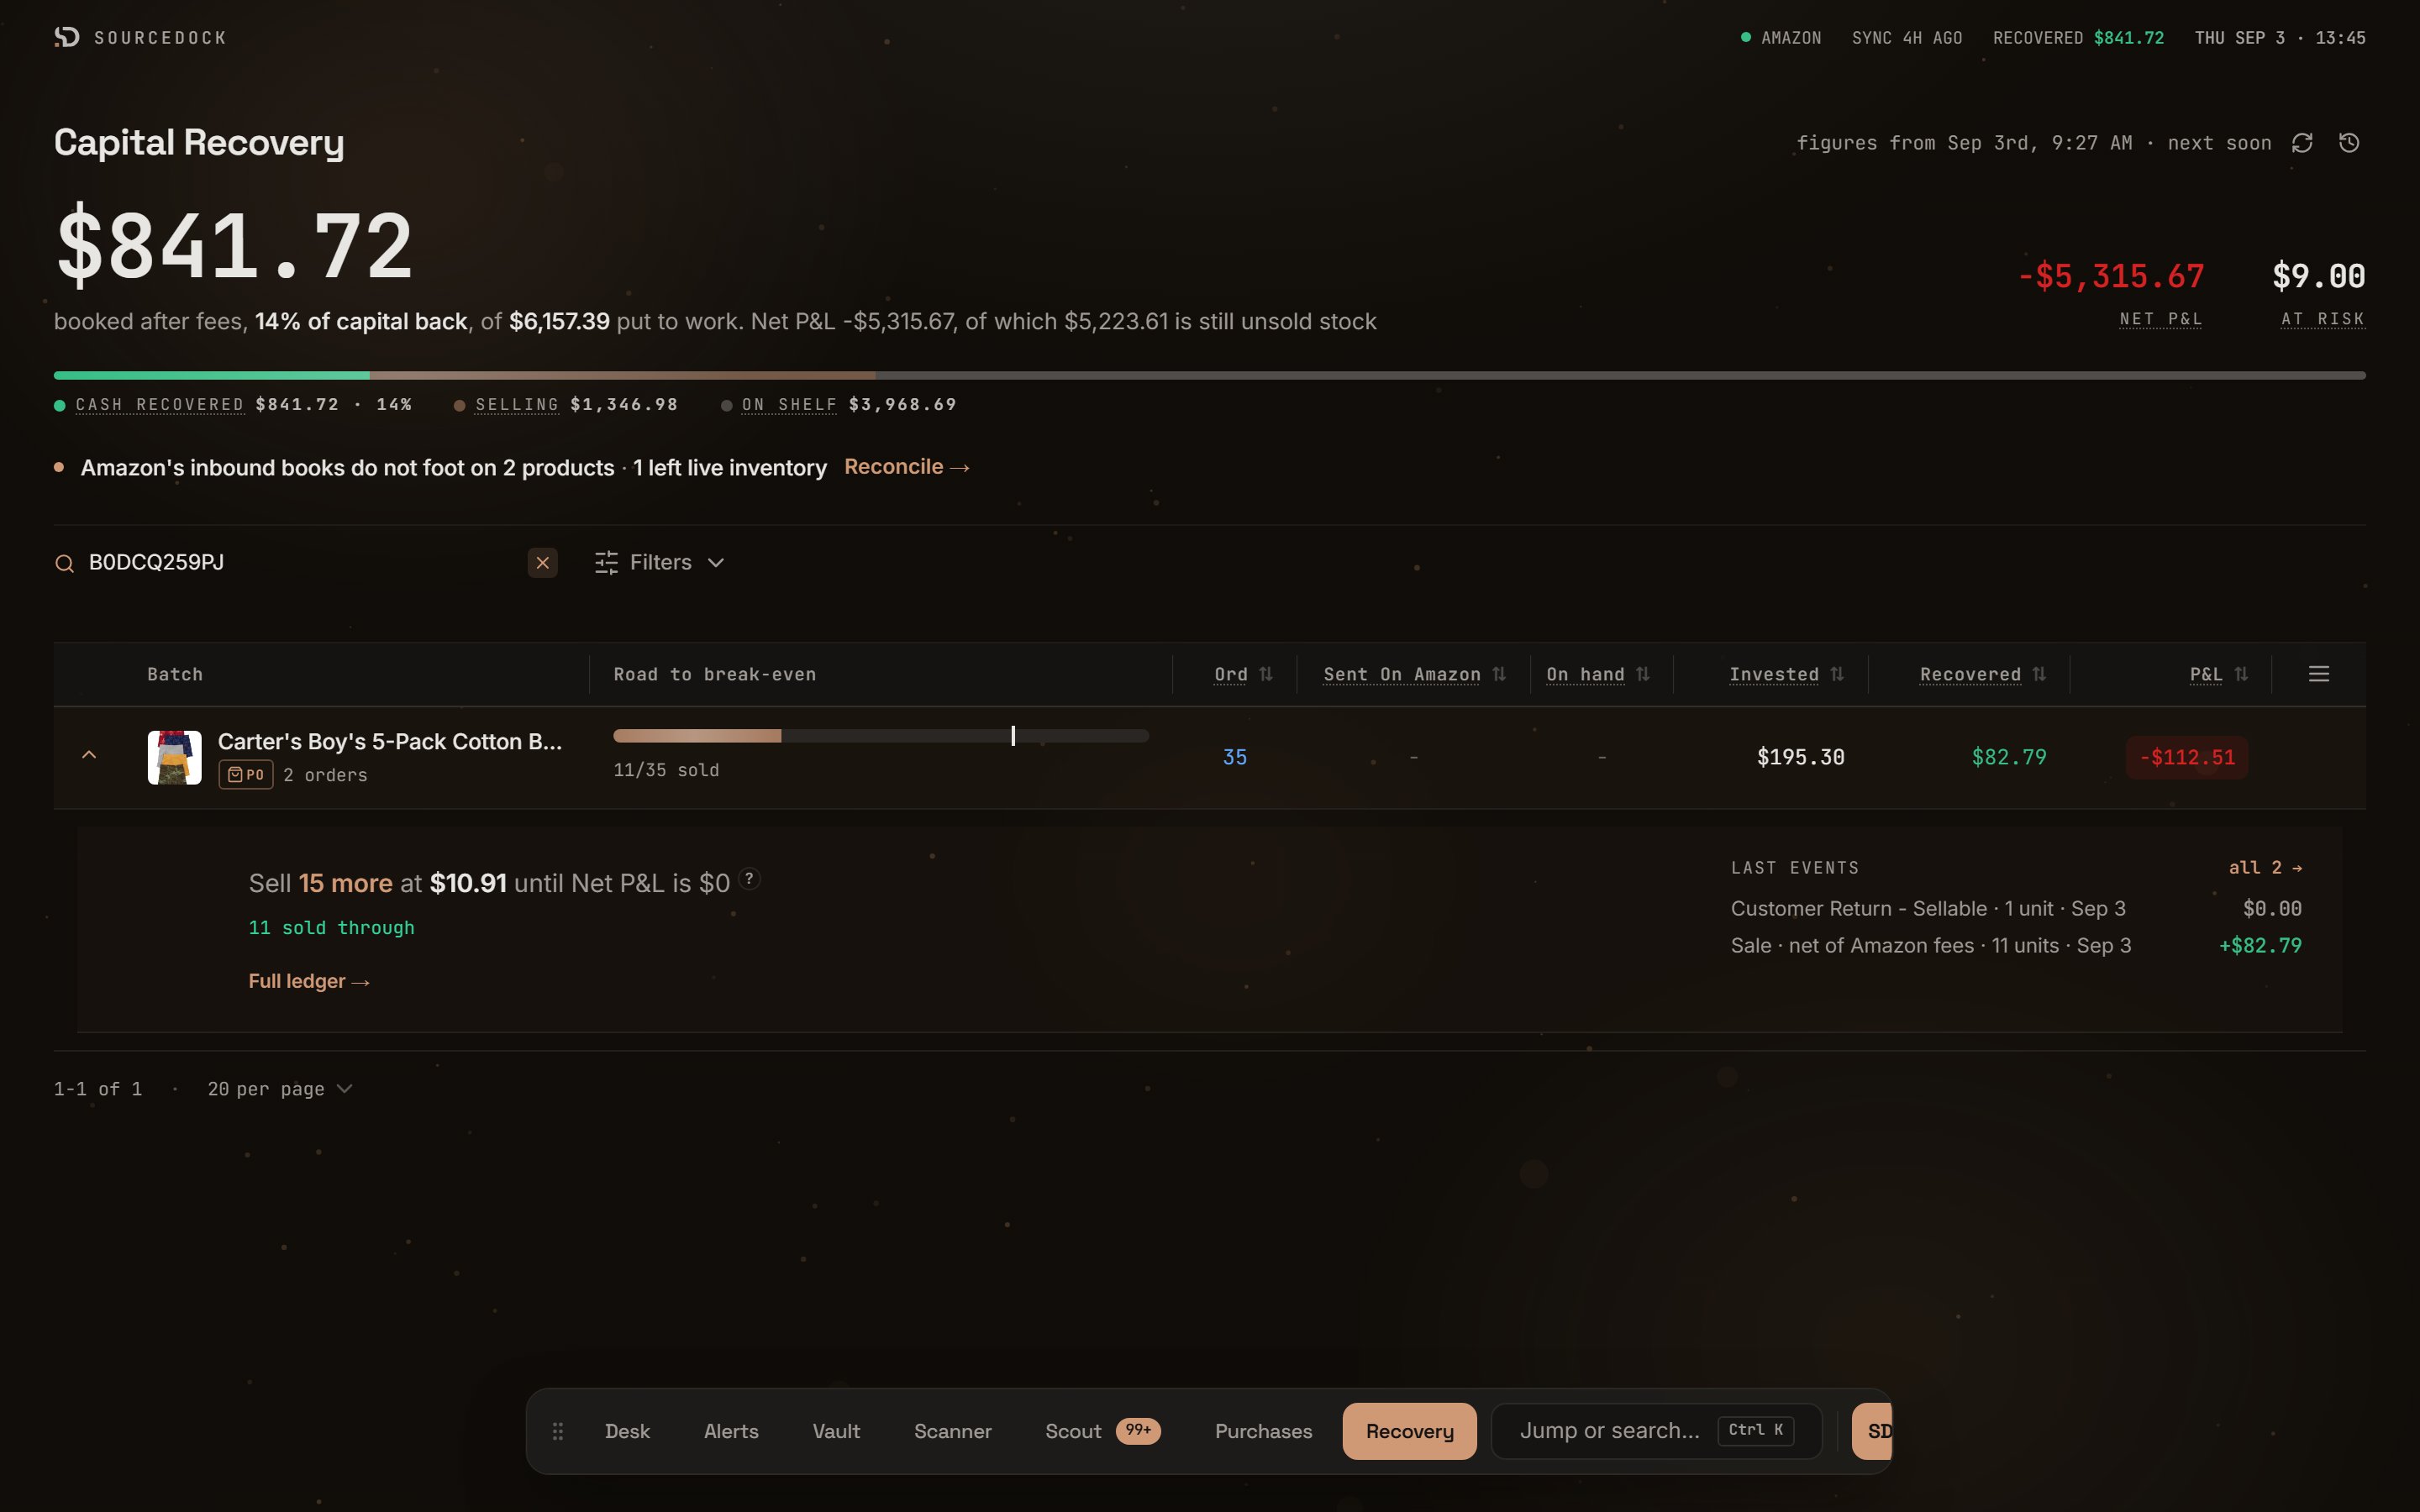
An expanded product row
The ledger drawer
The drawer has two tabs: LEDGER and EVENTS. A date range menu sits beside them: ALL TIME, LAST 30D, or LAST 90D.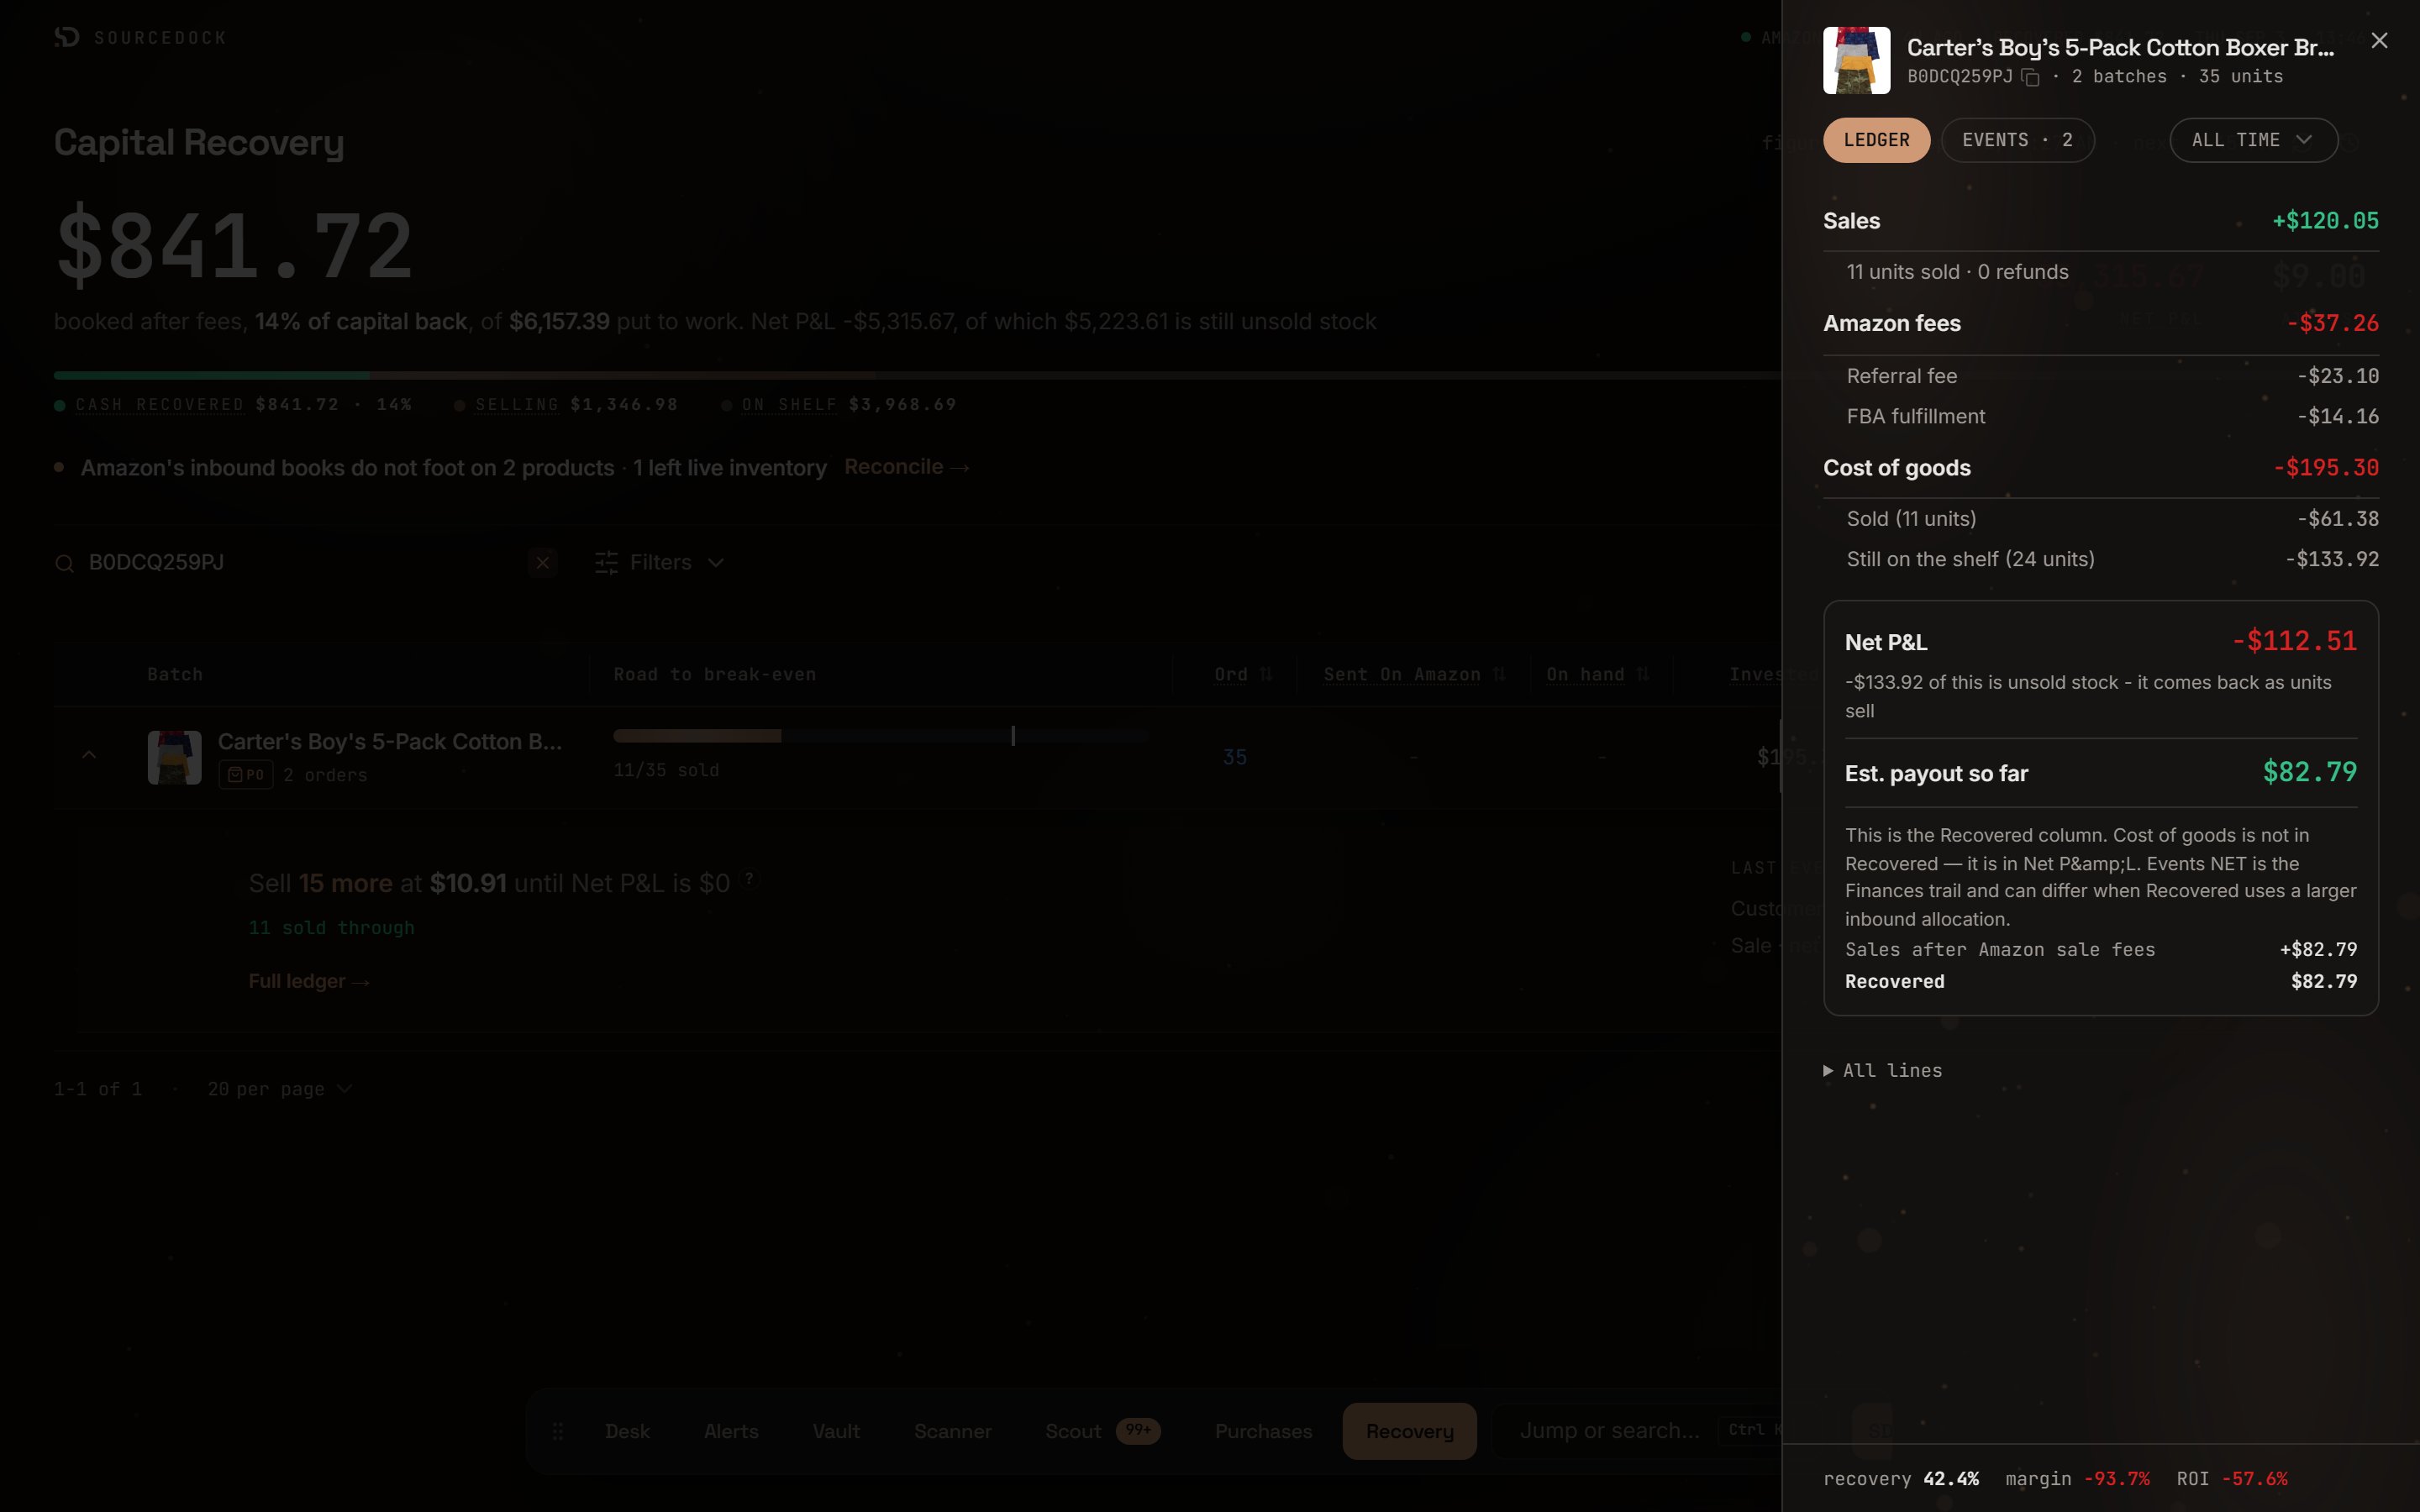
The ledger drawer
The LEDGER tab
The ledger shows the money in four groups.
Under the payout is a short list that adds up to Recovered. Sales after Amazon sale fees, plus reimbursements, minus inbound, placement, and other service fees.
The footer shows three rates. recovery is recovered divided by invested. margin is Net P&L divided by sales. ROI is Net P&L divided by invested.
When you pick a date range, sales and fees are for that window only. Net P&L stays all-time. The payout line reads “Est. payout this window”.
All lines and the Financial Breakdown
Click All lines at the bottom of the ledger. The full Financial Breakdown opens. This is the waterfall. It starts with sales and takes away each cost until it reaches net profit. Lines that are zero are hidden.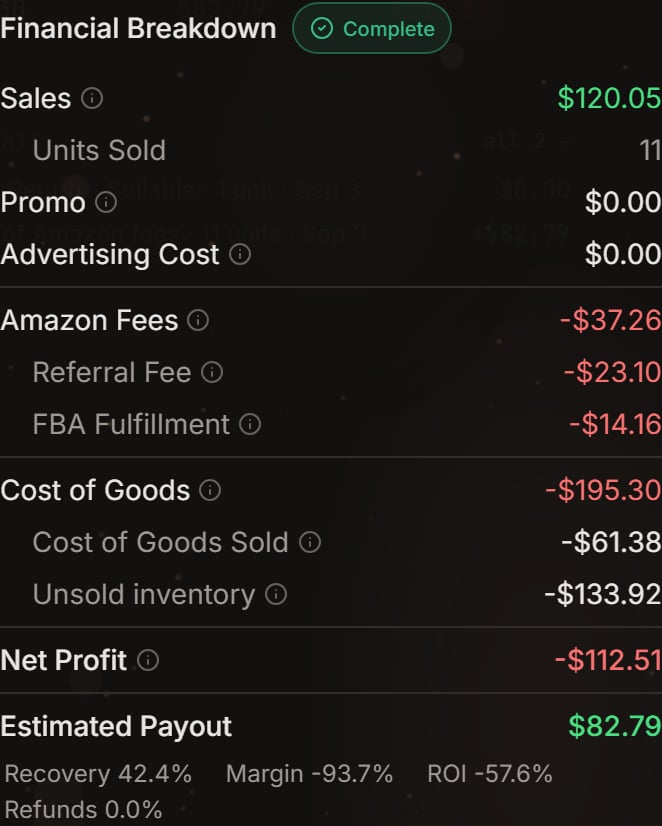
The Financial Breakdown waterfall
Under the lines are four rates: Recovery, Margin, ROI, and Refunds.
If a batch has no buy cost, the header says “Cost unknown”. Net Profit then has no cost of goods in it. Record the buy cost to get a real margin.
The data completeness badge
A small badge sits next to the Financial Breakdown title. It tells you how solid the figures are.
Why can events be missing? Amazon files events by the date money moved, not the order date. Old sales may have posted before your first sync reached back that far. A date-filtered view always shows Complete. It is built only from events.

The completeness badge
The EVENTS tab
This tab lists every Amazon event for the product. Pills filter by type: All, Sales, Fees, Refunds, Returns, Losses, Damages, and Reimb. for reimbursements. Sale amounts are what you got after fees, not the sale price. The bottom shows money Out, money In, and the Net.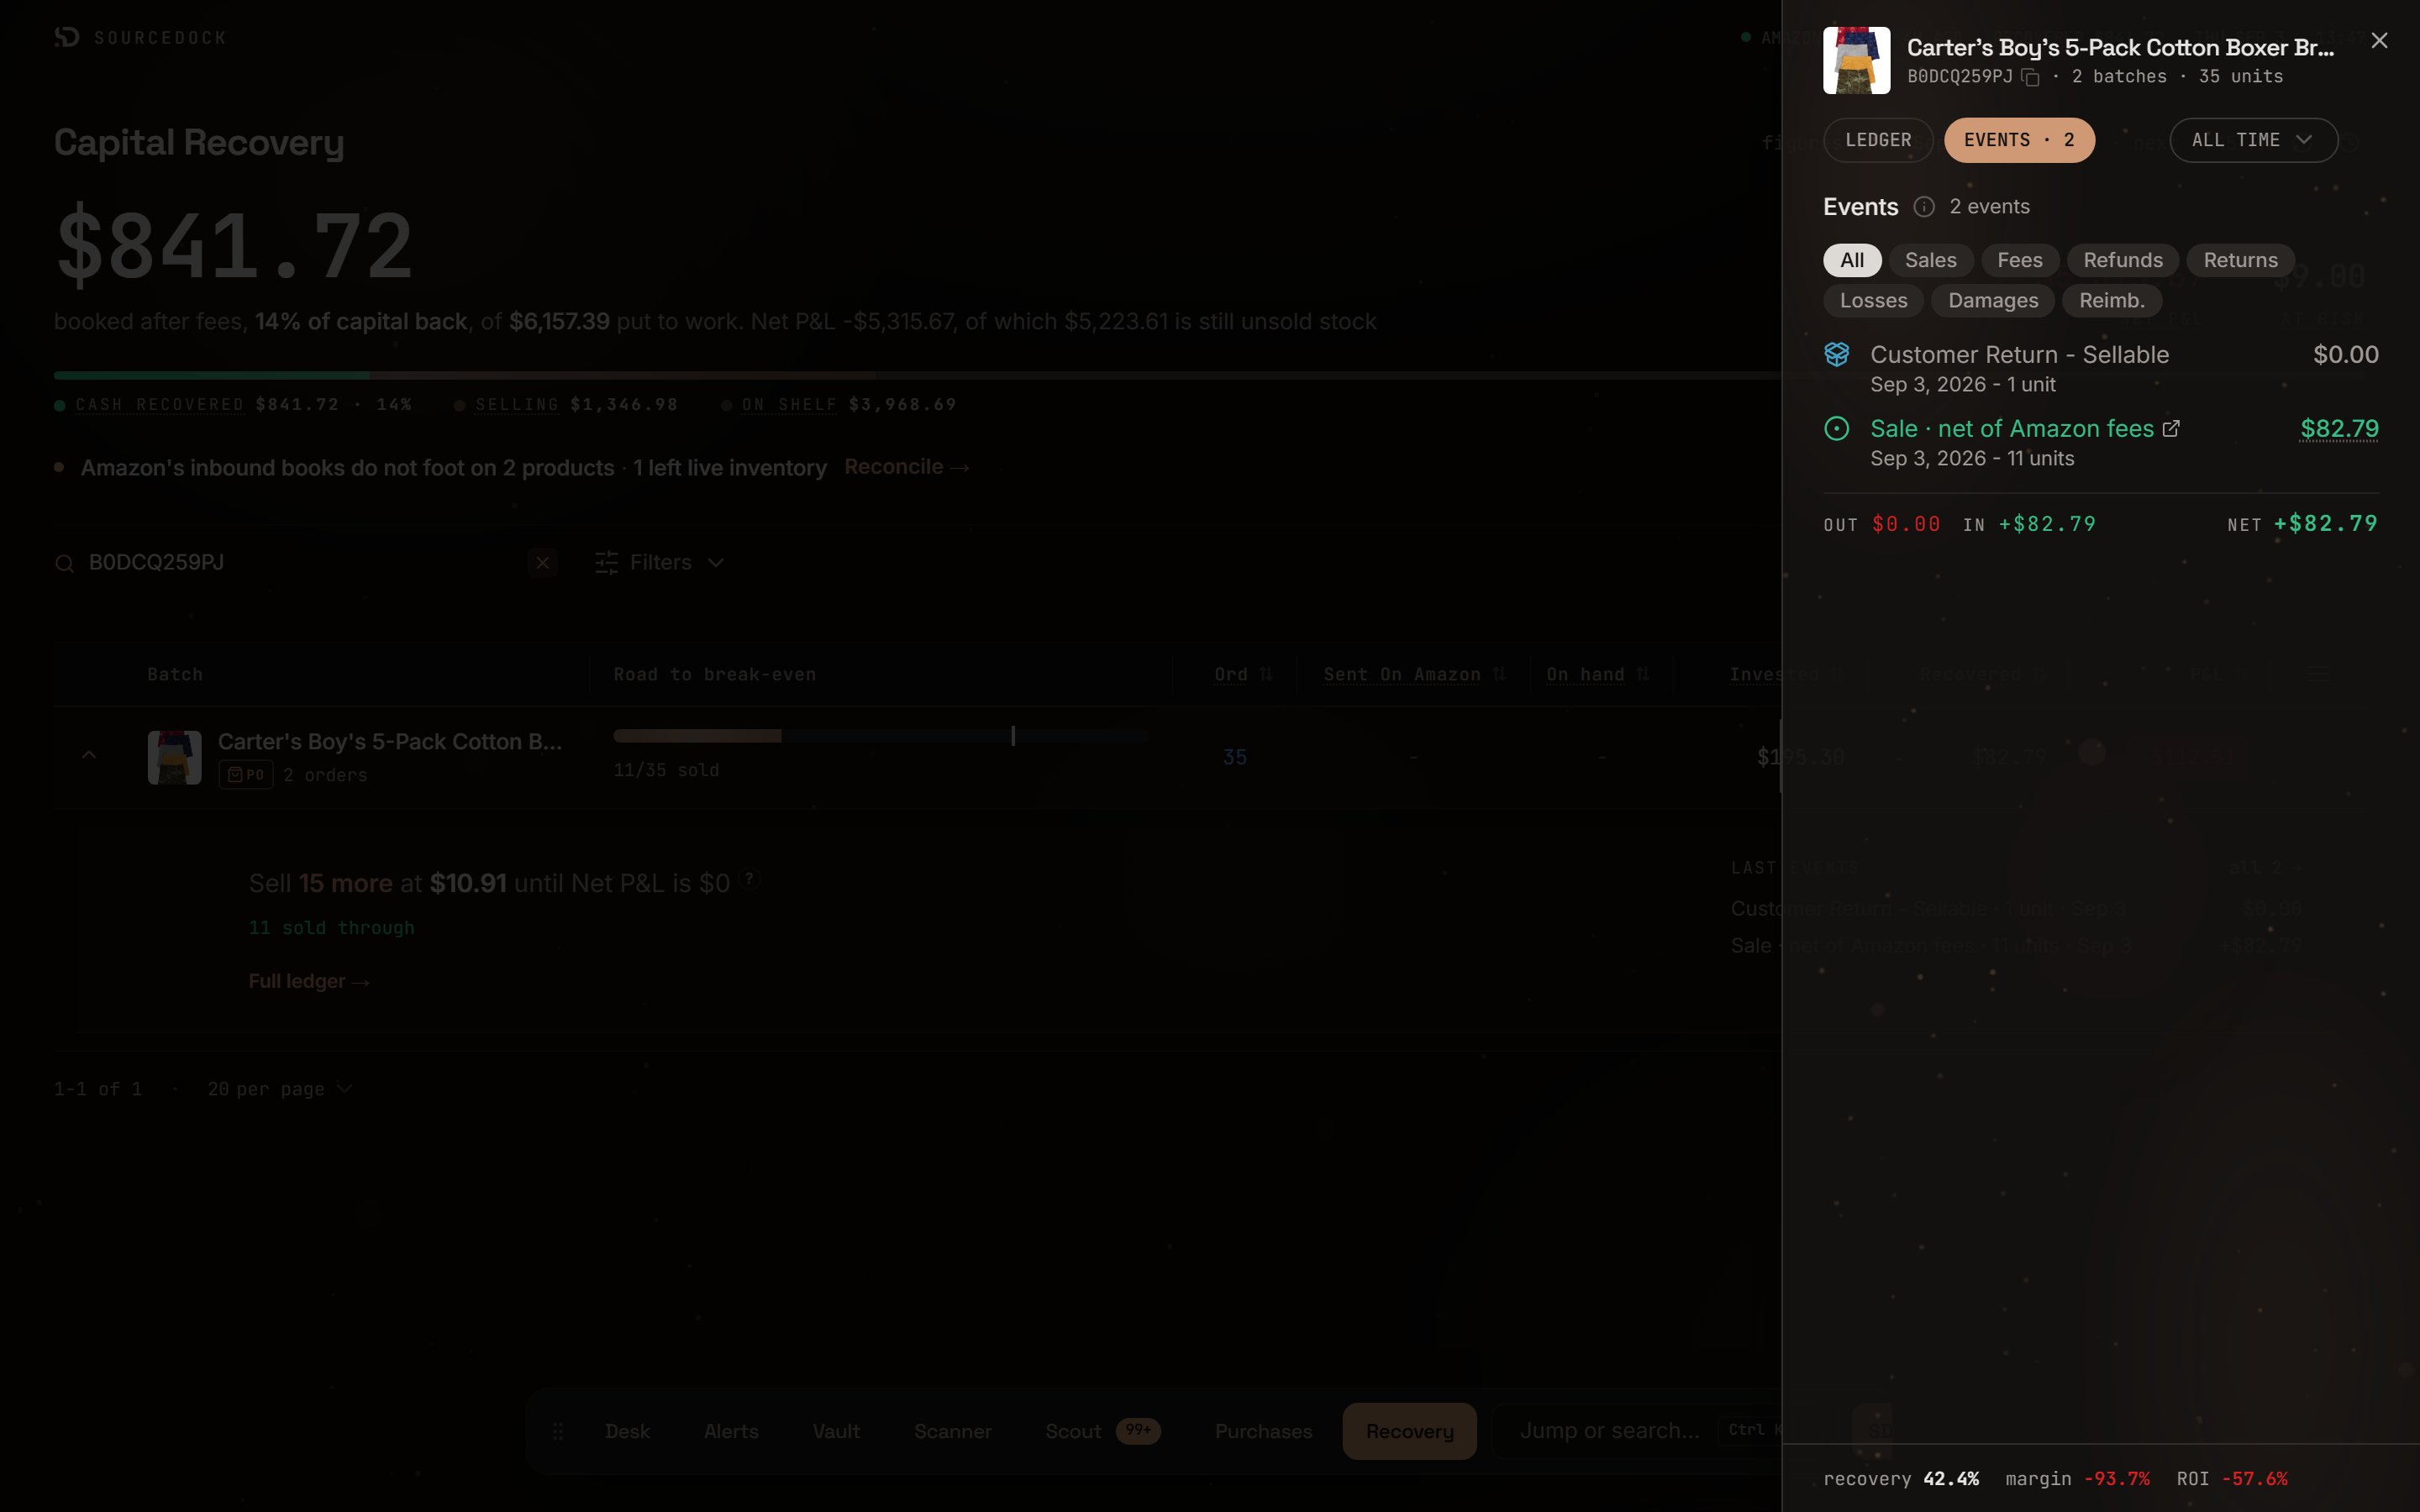
The events timeline
The review drawer
Open the page with?alerts=1 to see the Needs you drawer. It lists things to act on. Click Snooze 7d to hide an item for a week.
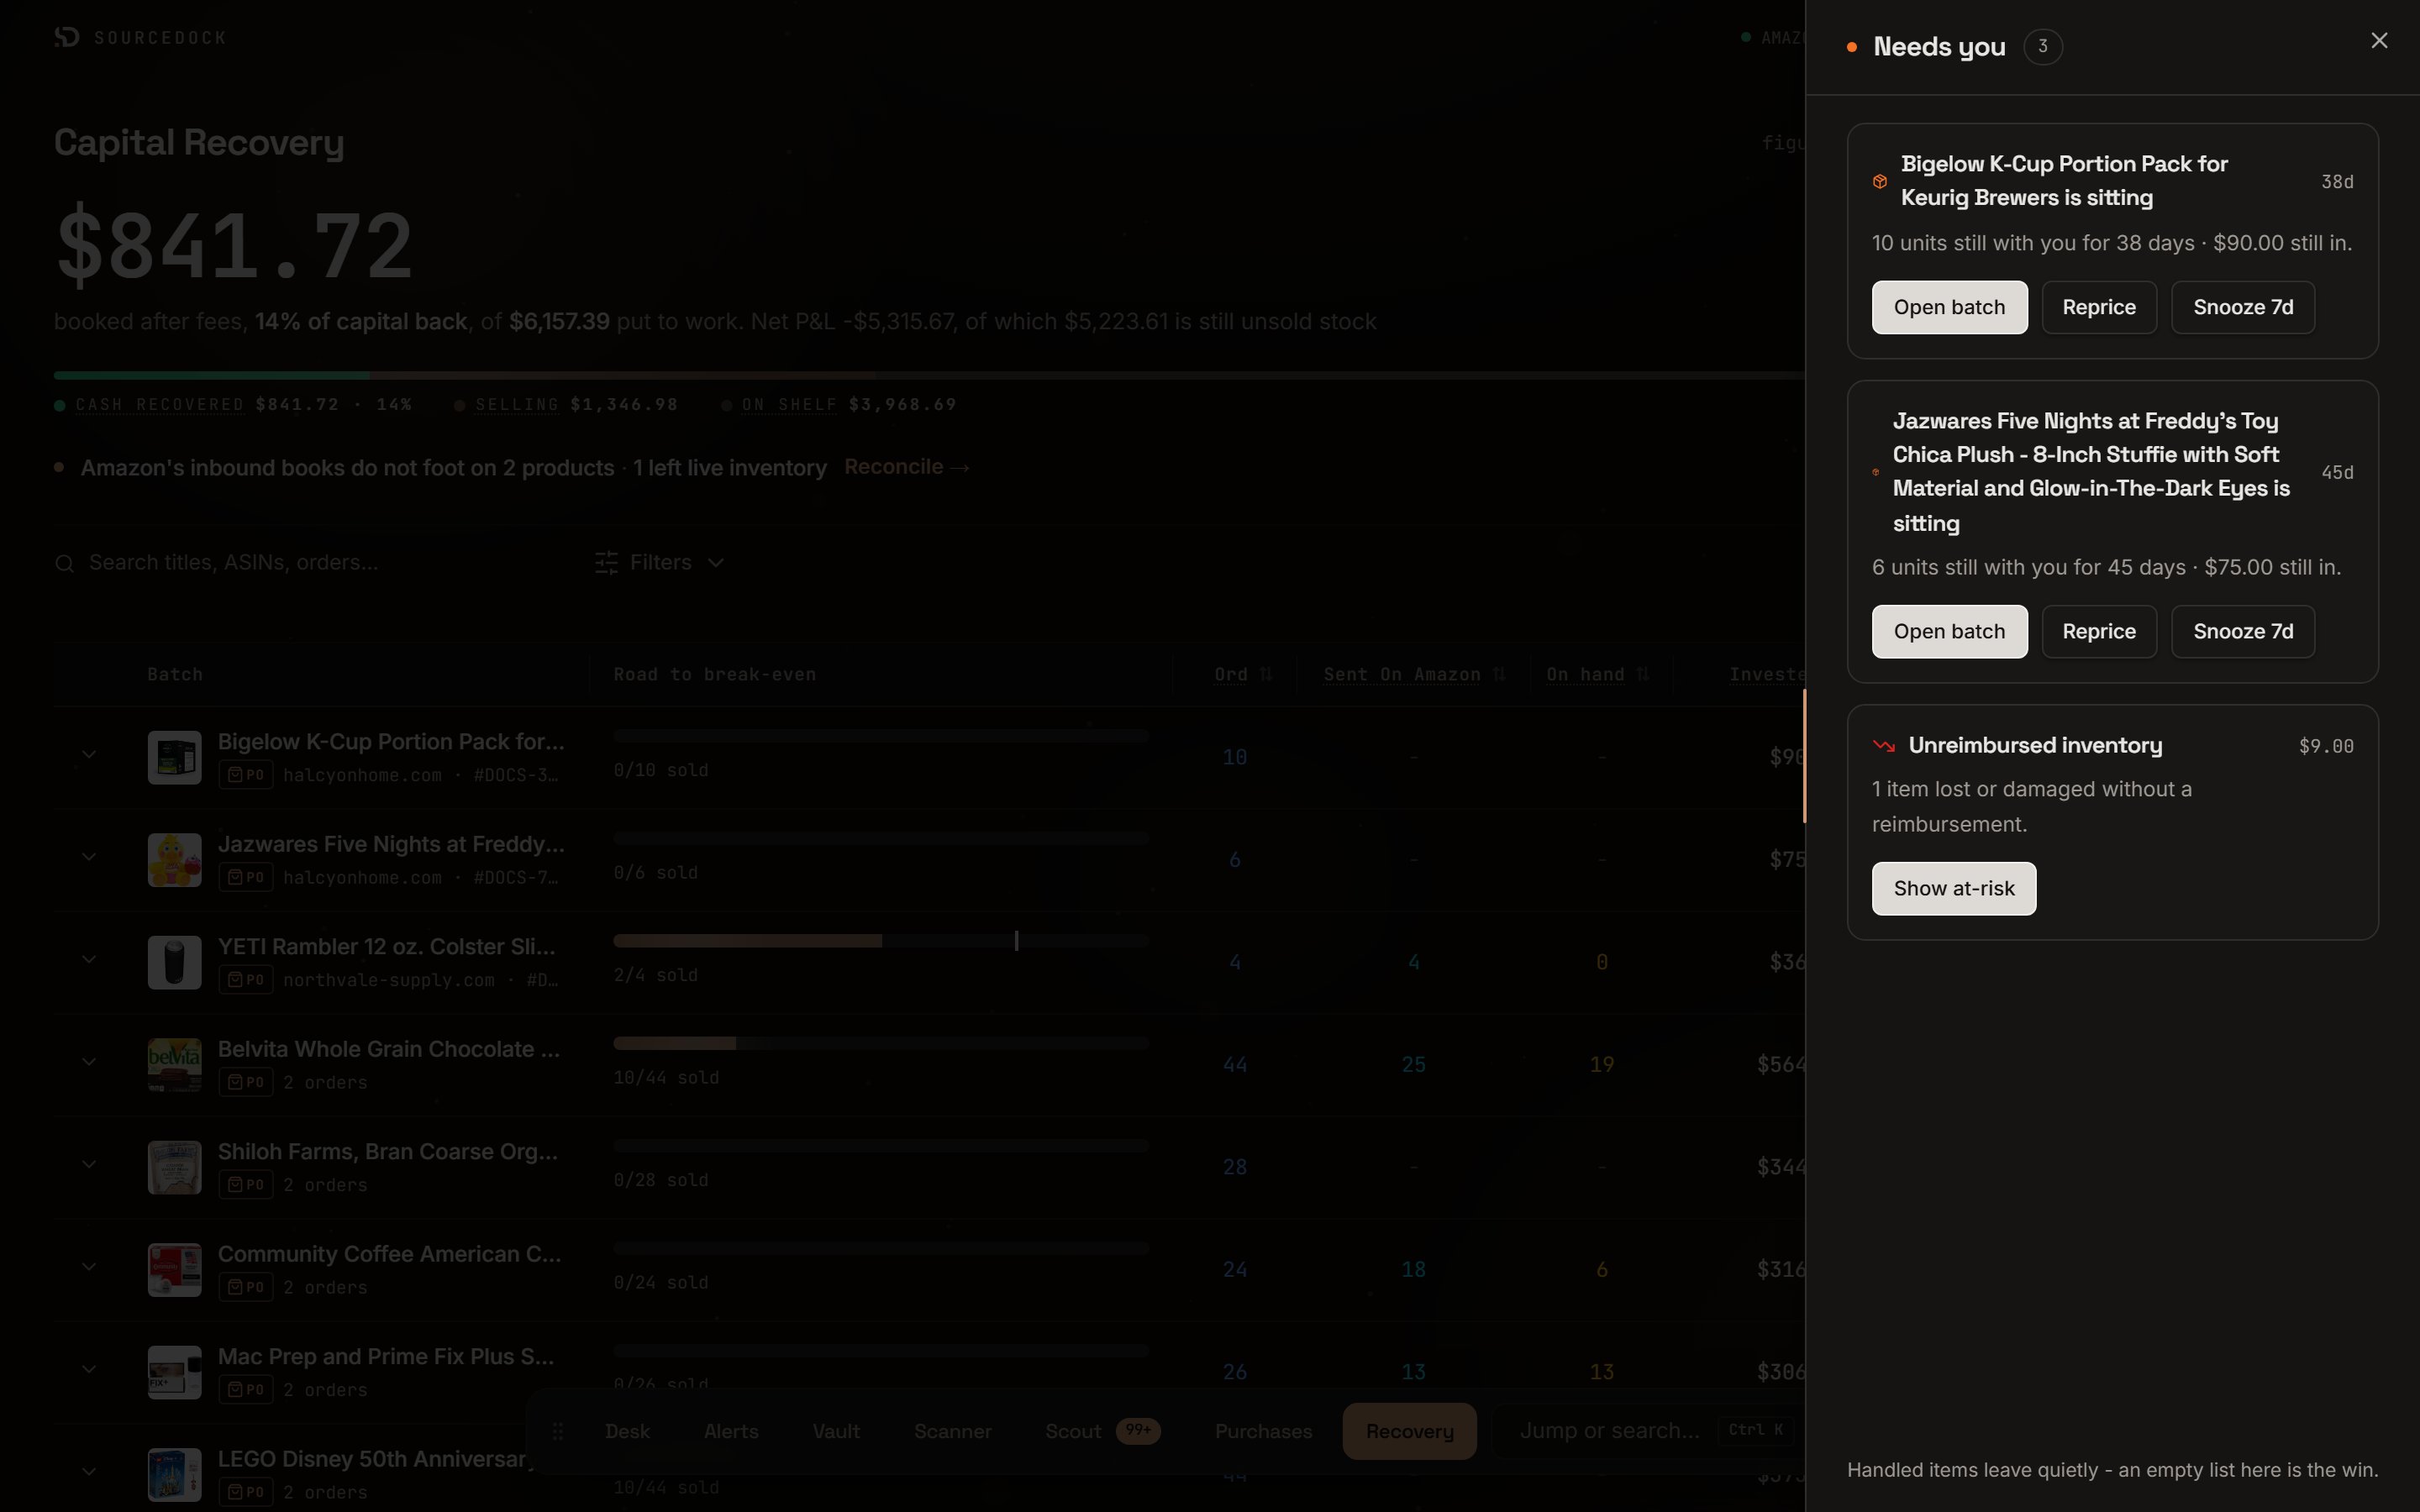
The Needs you drawer
Reconcile
When Amazon’s inbound counts do not match yours, a line appears under the header. Click Reconcile → to see only those products. The reconcile reference explains each message and what to do.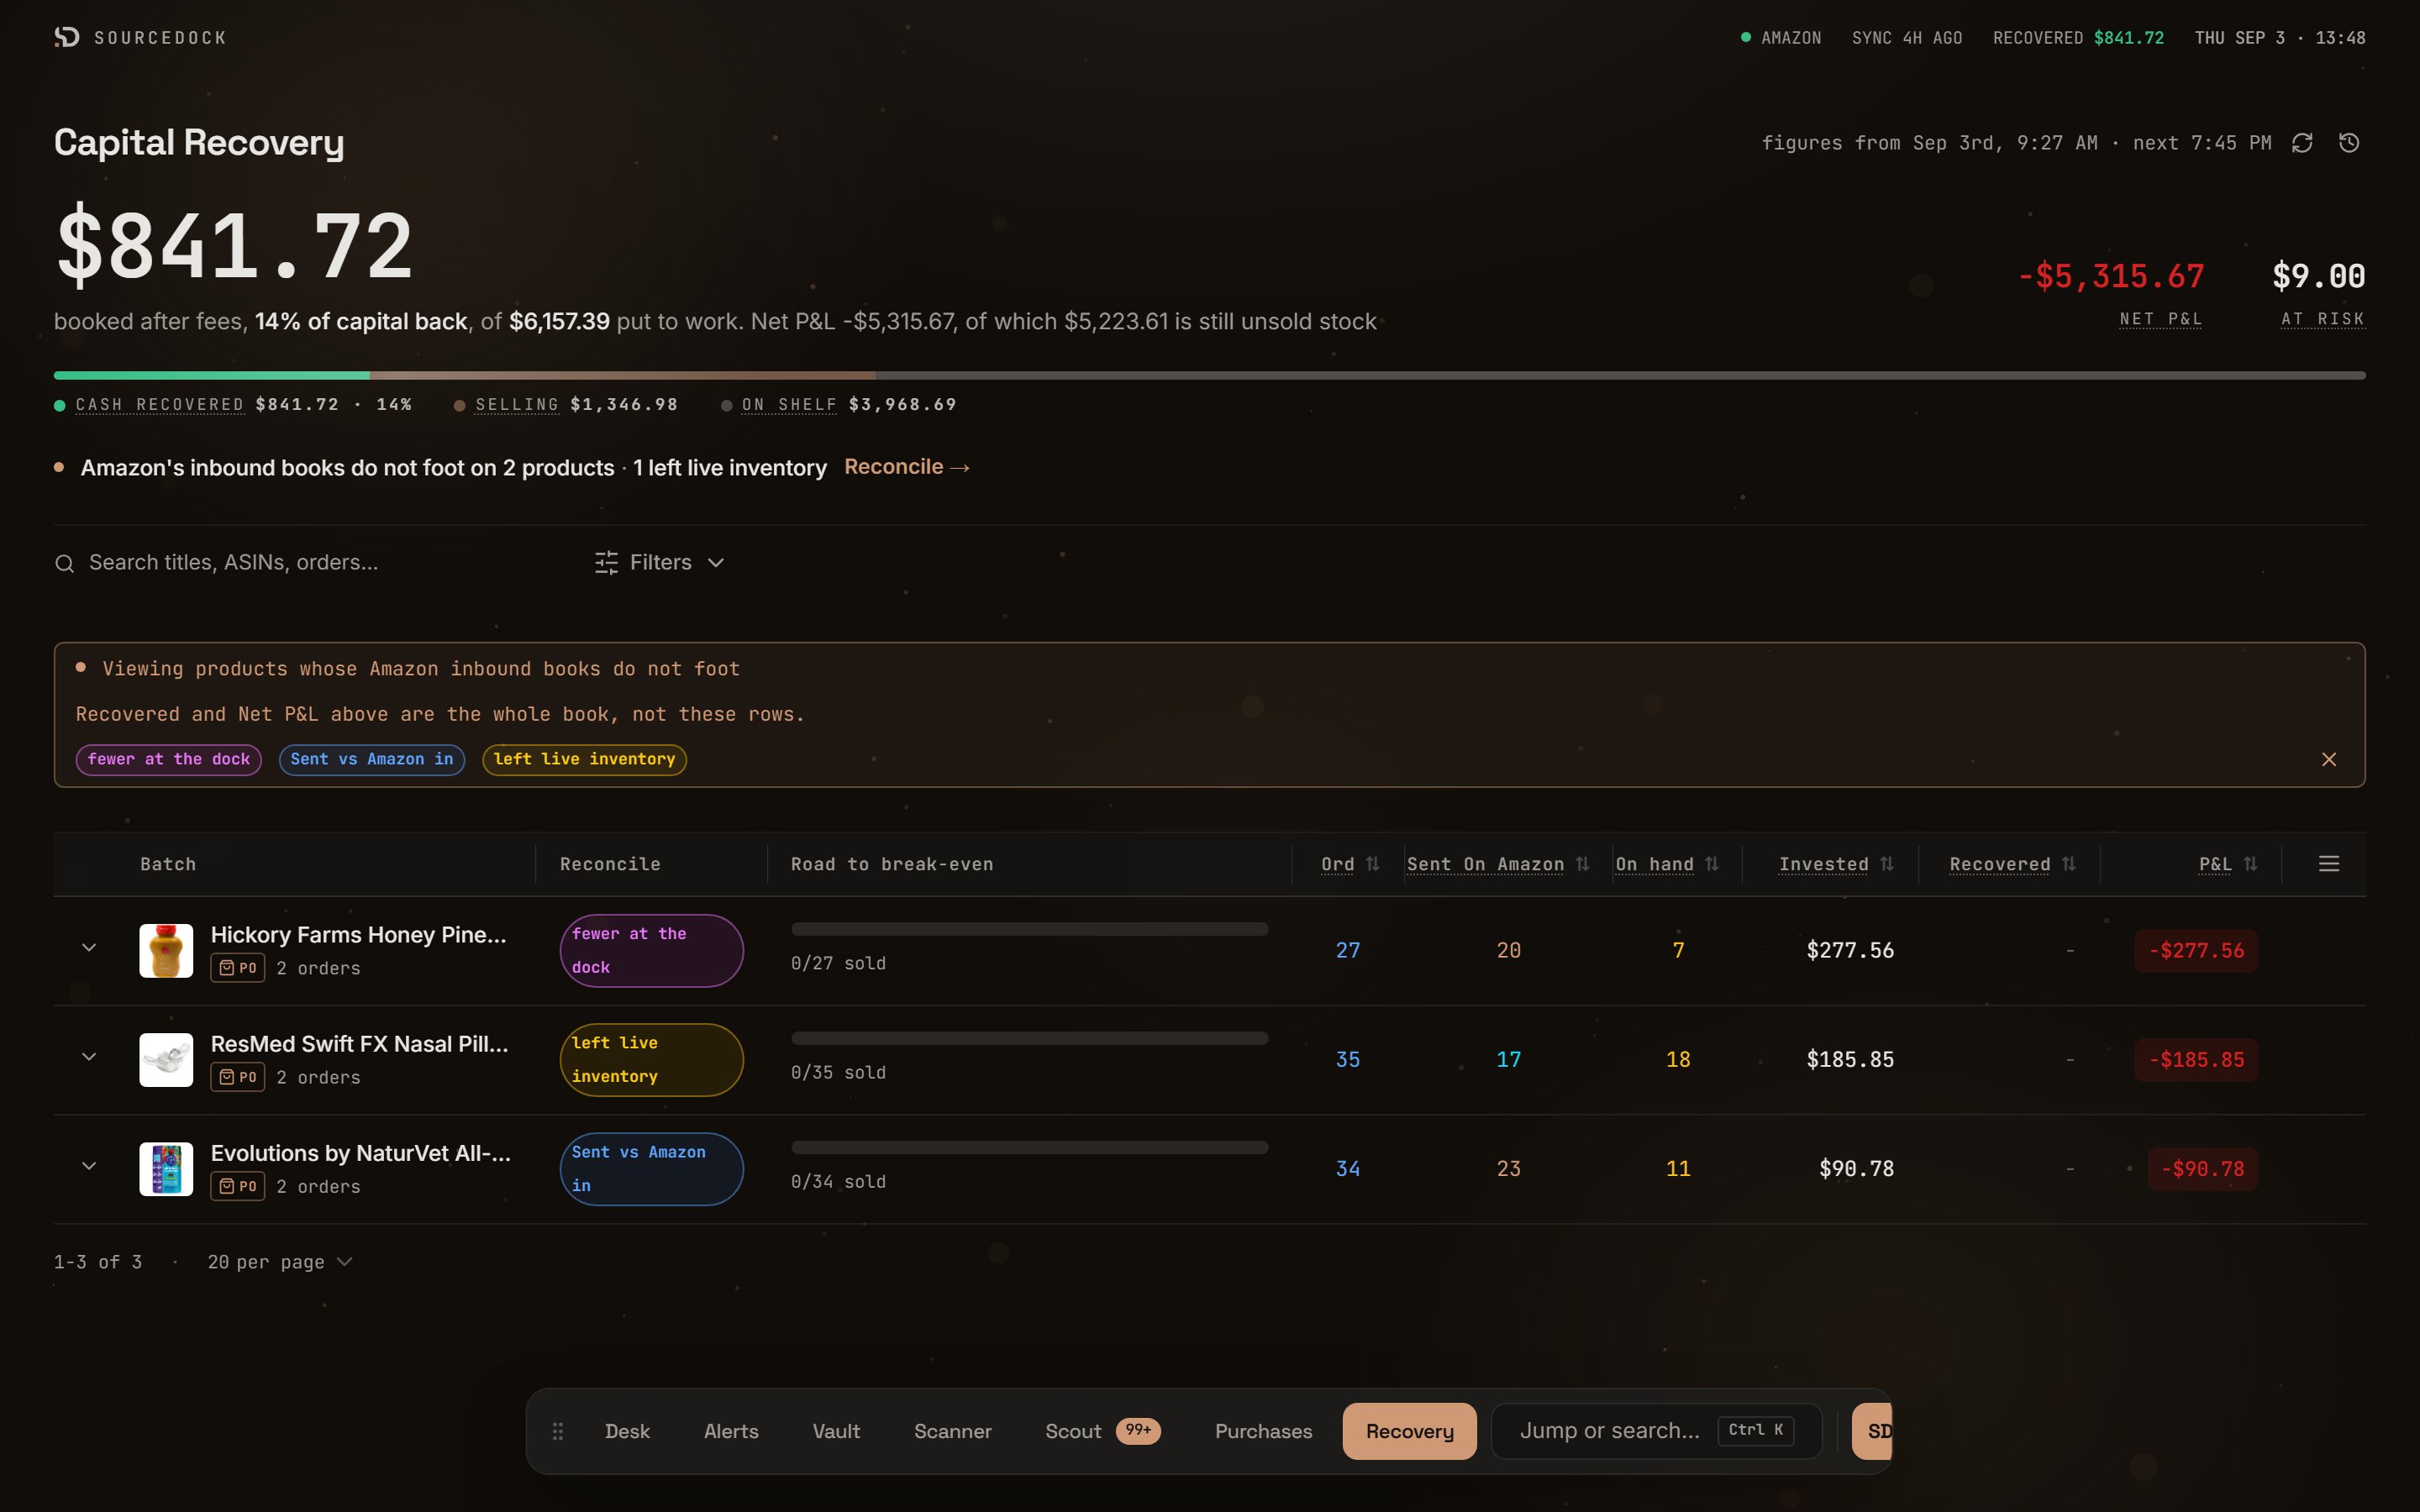
The reconcile view