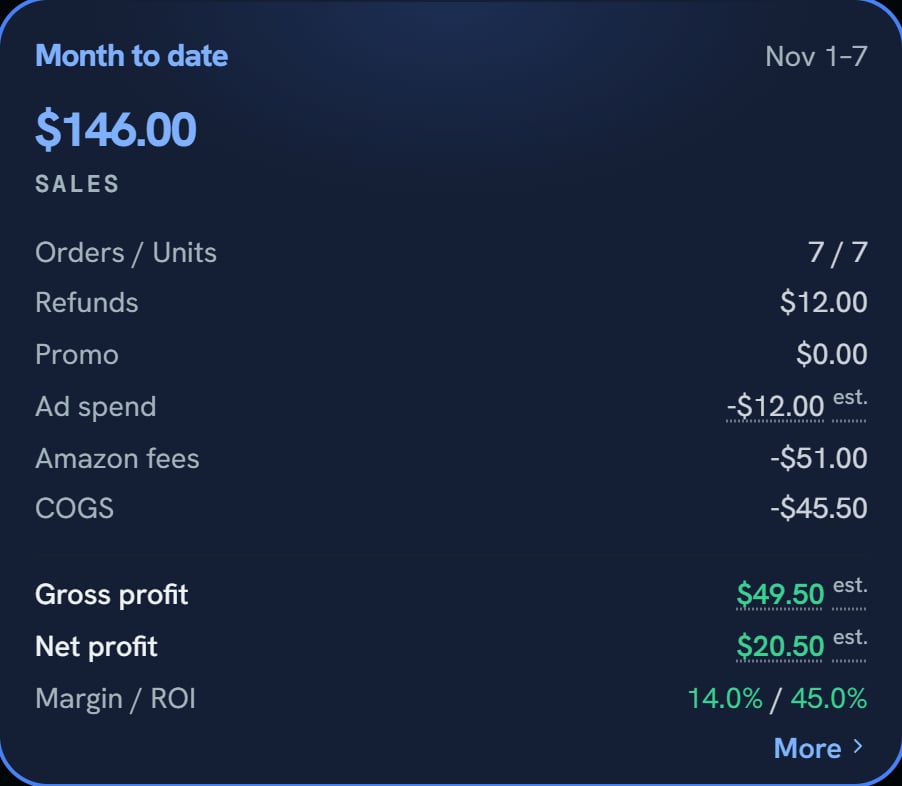
Under the title you see Last sync and Next sync. Those two times use your computer’s clock. The page first opens on Month to date. After that, it opens on the last period you picked.
Whole demo store: the top of the Sales page. Notice Last sync and Next sync under the title, and Custom with two day boxes above the tiles.
A new store
With no Amazon store, the page says Connect your Amazon store to see your sales. with a Connect Amazon button.Before the first pull, the top says figures pending. Until that pull loads your orders, every money figure is a dash. Pulling your sales history shows while SourceDock loads your past orders.
Pick your own days
Pick a Start day and an End day above the tiles. A Custom tile shows up. It can cover up to 366 days.
The page says
Why
Pick one year or less.
Your days are longer than that.
The start day is after the end day.
Swap them.
Pick days up to today.
A day is in the future.
SourceDock is still loading this store’s orders. Pick days once it is done.
The first pull isn’t done.
If you start before your first order day, the tile runs from that first day. The start box shows the new day.
Choose what the tiles show
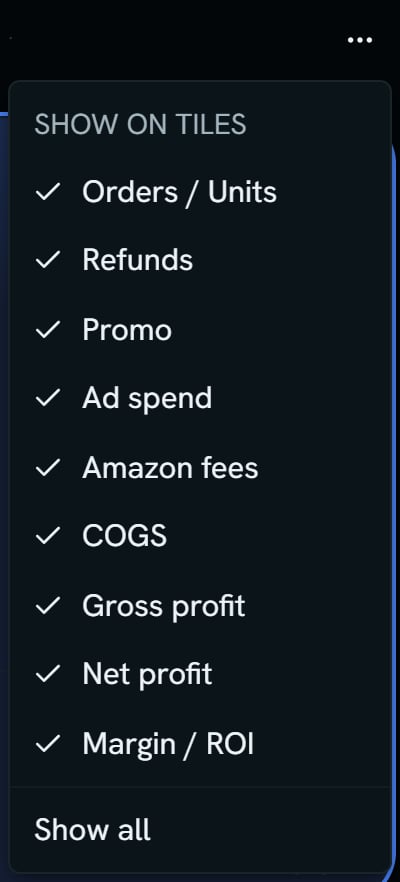
Click ⋯ above the tiles. The menu says Show on tiles. Every line starts on. Show all turns them all back on. Sales, the big number, always stays.
Whole demo store: the ⋯ menu above the tiles. Notice every line starts ticked, and Show all sits at the bottom.
The More box
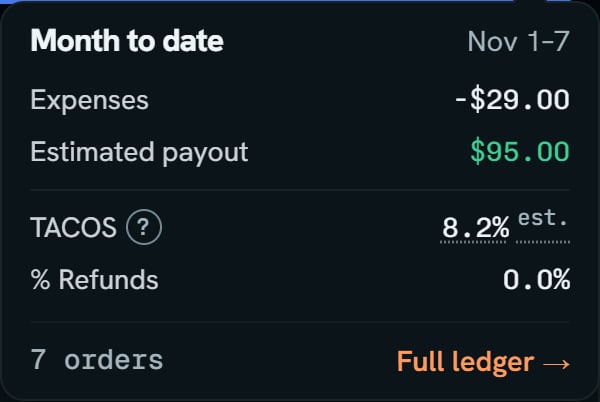
More on a tile opens a small box. It shows what the tile leaves out. Its foot gives the order count and Full ledger →.
Whole demo store: More, opened on the Month to date tile. Notice the foot: 7 orders, then Full ledger →.
Estimated payout: what Amazon pays you for this period. Cost of goods, ads paid by card, and your expenses aren’t in it.
TACOS: ad spend divided by all sales, not only sales the ads brought in. It means Total Advertising Cost of Sales. Lower is better.
% Refunds: units refunded divided by units sold.
{"docsConfig":{"theme":"mint","$schema":"https://mintlify.com/docs.json","name":"SourceDock","colors":{"primary":"#EA580C","light":"#FF9A5A","dark":"#EA580C"},"logo":{"light":"https://mintcdn.com/sourcedock/qOyT6VleObj7HrsZ/logo/light.svg?fit=max\u0026auto=format\u0026n=qOyT6VleObj7HrsZ\u0026q=85\u0026s=fac497db707183ccf027093f15f21cd7","dark":"https://mintcdn.com/sourcedock/qOyT6VleObj7HrsZ/logo/dark.svg?fit=max\u0026auto=format\u0026n=qOyT6VleObj7HrsZ\u0026q=85\u0026s=7c4a164f66e528a64c1d35bc9596867e","href":"https://sourcedock.io"},"favicon":"https://mintcdn.com/sourcedock/PvFEadQJVbcHct-s/favicon.png?fit=max\u0026auto=format\u0026n=PvFEadQJVbcHct-s\u0026q=85\u0026s=b2a8ed72213fc5eb8082f24866be78d9","appearance":{"default":"dark"},"background":{"color":{"dark":"#020609"}},"navbar":{"links":[{"href":"https://discord.gg/ssWsu5jHe","label":"Community"}],"primary":{"type":"button","label":"Open SourceDock","href":"https://app.sourcedock.io"}},"footer":{"socials":{"website":"https://sourcedock.io","discord":"https://discord.gg/ssWsu5jHe"}},"icons":{"library":"lucide"},"styling":{"latex":false},"navigation":{"pages":[]}},"deployment":{"deploymentMetadataValue":{"subdomain":"sourcedock","hasAudioNarration":false,"actualSubdomain":"sourcedock","customDomains":["docs.sourcedock.io"],"gitSource":{"type":"github","owner":"source-dock","repo":"sourcedock-docs","deployBranch":"main","contentDirectory":"","isPrivate":true,"mountPath":"","label":""},"entitlements":{"AI_CHAT":{"status":"DISABLED"}},"buildId":"6b010c47965586a741a14e90","clientVersion":"0.0.4270","searchFilterCounts":[{"language":"default","tag":"Docs","count":190},{"language":"default","tag":"Operate","count":62},{"language":"default","tag":"Get started","count":52},{"language":"default","tag":"Academy","count":29},{"language":"default","tag":"Source","count":27},{"language":"default","tag":"The desk","count":26},{"language":"default","tag":"Reference","count":19},{"language":"default","tag":"Chrome extension","count":16},{"language":"default","tag":"Claims","count":12},{"language":"default","tag":"Capital Recovery","count":11}]},"assistantConfig":{"enableAskAiButton":false,"enableStarterQuestions":false,"enableContextualStarterQuestions":false,"enableAskAiSearchBar":true},"basePath":"","hasChatPermissions":false,"hasWebMcpPermissions":false,"toggles":[{"name":"kill-isr","enabled":true,"variant":{"name":"disabled","enabled":false,"feature_enabled":true},"impressionData":false},{"name":"custom-rbac-roles","enabled":true,"variant":{"name":"disabled","enabled":false,"feature_enabled":true},"impressionData":false},{"name":"agent-mintlify-slack","enabled":true,"variant":{"name":"disabled","enabled":false,"feature_enabled":true},"impressionData":false},{"name":"agent-integrations-settings","enabled":true,"variant":{"name":"disabled","enabled":false,"feature_enabled":true},"impressionData":false},{"name":"rbac-expansion","enabled":true,"variant":{"name":"disabled","enabled":false,"feature_enabled":true},"impressionData":false},{"name":"automations-pr-grouping","enabled":true,"variant":{"name":"disabled","enabled":false,"feature_enabled":true},"impressionData":false},{"name":"custom-prefix","enabled":true,"variant":{"name":"disabled","enabled":false,"feature_enabled":true},"impressionData":false},{"name":"analytics-v7","enabled":true,"variant":{"name":"disabled","enabled":false,"feature_enabled":true},"impressionData":false},{"name":"user-flows-analytics","enabled":true,"variant":{"name":"disabled","enabled":false,"feature_enabled":true},"impressionData":false},{"name":"no-publish-flow","enabled":true,"variant":{"name":"disabled","enabled":false,"feature_enabled":true},"impressionData":false},{"name":"workos-onboarding","enabled":true,"variant":{"name":"disabled","enabled":false,"feature_enabled":true},"impressionData":false},{"name":"snapshot-serving-live","enabled":true,"variant":{"name":"disabled","enabled":false,"feature_enabled":true},"impressionData":false},{"name":"stripTemperatureMiddleware","enabled":true,"variant":{"name":"disabled","enabled":false,"feature_enabled":true},"impressionData":false},{"name":"support-platform-pylon-zendesk","enabled":true,"variant":{"name":"disabled","enabled":false,"feature_enabled":true},"impressionData":false},{"name":"snapshot-serving","enabled":true,"variant":{"name":"disabled","enabled":false,"feature_enabled":true},"impressionData":false},{"name":"instant-rollback","enabled":true,"variant":{"name":"disabled","enabled":false,"feature_enabled":true},"impressionData":false},{"name":"granular-notifications-server","enabled":true,"variant":{"name":"disabled","enabled":false,"feature_enabled":true},"impressionData":false},{"name":"granular-notifications","enabled":true,"variant":{"name":"disabled","enabled":false,"feature_enabled":true},"impressionData":false},{"name":"automations-fable","enabled":true,"variant":{"name":"disabled","enabled":false,"feature_enabled":true},"impressionData":false},{"name":"fixed-ai-action-pricing","enabled":true,"variant":{"name":"disabled","enabled":false,"feature_enabled":true},"impressionData":false},{"name":"site-roles","enabled":true,"variant":{"name":"disabled","enabled":false,"feature_enabled":true},"impressionData":false},{"name":"automation-resolve-merge-conflict","enabled":true,"variant":{"name":"disabled","enabled":false,"feature_enabled":true},"impressionData":false},{"name":"scoped-publishing","enabled":true,"variant":{"name":"disabled","enabled":false,"feature_enabled":true},"impressionData":false},{"name":"mintql","enabled":true,"variant":{"name":"disabled","enabled":false,"feature_enabled":true},"impressionData":false},{"name":"page-level-analytics","enabled":true,"variant":{"name":"disabled","enabled":false,"feature_enabled":true},"impressionData":false},{"name":"editor-version-history-v2","enabled":true,"variant":{"name":"disabled","enabled":false,"feature_enabled":true},"impressionData":false},{"name":"billing-page-v2","enabled":true,"variant":{"name":"disabled","enabled":false,"feature_enabled":true},"impressionData":false},{"name":"full-page-search","enabled":true,"variant":{"name":"disabled","enabled":false,"feature_enabled":true},"impressionData":false},{"name":"workspace-projects","enabled":true,"variant":{"name":"disabled","enabled":false,"feature_enabled":true},"impressionData":false},{"name":"assistant-v5","enabled":true,"variant":{"name":"disabled","enabled":false,"feature_enabled":true},"impressionData":false},{"name":"fork-pr-previews","enabled":true,"variant":{"name":"disabled","enabled":false,"feature_enabled":true},"impressionData":false},{"name":"revalidation-jwt","enabled":true,"variant":{"name":"disabled","enabled":false,"feature_enabled":true},"impressionData":false},{"name":"workos-sso-scim","enabled":true,"variant":{"name":"disabled","enabled":false,"feature_enabled":true},"impressionData":false},{"name":"hobby-abuse-scan","enabled":true,"variant":{"name":"disabled","enabled":false,"feature_enabled":true},"impressionData":false},{"name":"dashboard-inbox","enabled":true,"variant":{"name":"disabled","enabled":false,"feature_enabled":true},"impressionData":false},{"name":"workos-signup","enabled":true,"variant":{"name":"disabled","enabled":false,"feature_enabled":true},"impressionData":false},{"name":"turbopuffer-dual-write","enabled":true,"variant":{"name":"disabled","enabled":false,"feature_enabled":true},"impressionData":false},{"name":"workos-enabled","enabled":true,"variant":{"name":"disabled","enabled":false,"feature_enabled":true},"impressionData":false},{"name":"approve-review-flow","enabled":true,"variant":{"name":"disabled","enabled":false,"feature_enabled":true},"impressionData":false},{"name":"editor-metadata","enabled":true,"variant":{"name":"disabled","enabled":false,"feature_enabled":true},"impressionData":false},{"name":"sso-setup-deadline-banner","enabled":true,"variant":{"name":"disabled","enabled":false,"feature_enabled":true},"impressionData":false},{"name":"turbopuffer-serve","enabled":true,"variant":{"name":"disabled","enabled":false,"feature_enabled":true},"impressionData":false},{"name":"live-agents","enabled":true,"variant":{"name":"disabled","enabled":false,"feature_enabled":true},"impressionData":false},{"name":"starter-pricing","enabled":true,"variant":{"name":"control","enabled":true,"payload":{"type":"string","value":"control"},"feature_enabled":true},"impressionData":false},{"name":"llms-txt-v2","enabled":true,"variant":{"name":"disabled","enabled":false,"feature_enabled":true},"impressionData":false},{"name":"wildcard-email-auth","enabled":true,"variant":{"name":"disabled","enabled":false,"feature_enabled":true},"impressionData":false}],"googleFontsInlined":false},"customCss":[{"filePath":"academy.css","content":".sd-orange-text{color:#C2410C}.dark .sd-orange-text{color:#FF9A5A}"}]}
{"page":{"pagePath":"operate/sales-tiles","slug":"/operate/sales-tiles","pageMetadata":{"title":"The Sales tiles","sidebarTitle":"The tiles","description":"3 min read · Each tile is one time period. Pick a tile, pick your own days, and choose what the tiles show.","icon":"layout-grid","href":"/operate/sales-tiles"},"description":{"compiledSource":"\"use strict\";\nconst {jsx: _jsx} = arguments[0];\nconst {useMDXComponents: _provideComponents} = arguments[0];\nfunction _createMdxContent(props) {\n const _components = {\n p: \"p\",\n ..._provideComponents(),\n ...props.components\n };\n return _jsx(_components.p, {\n children: \"3 min read · Each tile is one time period. Pick a tile, pick your own days, and choose what the tiles show.\"\n });\n}\nfunction MDXContent(props = {}) {\n const {wrapper: MDXLayout} = {\n ..._provideComponents(),\n ...props.components\n };\n return MDXLayout ? _jsx(MDXLayout, {\n ...props,\n children: _jsx(_createMdxContent, {\n ...props\n })\n }) : _createMdxContent(props);\n}\nreturn {\n default: MDXContent\n};\n","frontmatter":{},"scope":{}},"pageType":"default","mdx":{"mdxSource":{"compiledSource":"\"use strict\";const{Fragment:_Fragment,jsx:_jsx,jsxs:_jsxs}=arguments[0];const{useMDXComponents:_provideComponents}=arguments[0];function _createMdxContent(props){const _components={a:`a`,li:`li`,p:`p`,strong:`strong`,tbody:`tbody`,td:`td`,th:`th`,thead:`thead`,tr:`tr`,ul:`ul`,..._provideComponents(),...props.components},{Accordion,AccordionGroup,Frame,Heading,OptimizedImage,Table}=_components;if(!Accordion)_missingMdxReference(`Accordion`,true);if(!AccordionGroup)_missingMdxReference(`AccordionGroup`,true);if(!Frame)_missingMdxReference(`Frame`,true);if(!Heading)_missingMdxReference(`Heading`,true);if(!OptimizedImage)_missingMdxReference(`OptimizedImage`,true);if(!Table)_missingMdxReference(`Table`,true);return _jsxs(_Fragment,{children:[_jsx(Heading,{level:`2`,id:`in-short`,children:`In short`}),`\n`,_jsx(_components.p,{children:`Each tile is one time period. Click a tile to show it in the chart and the product table. Each date is on Amazon’s Pacific clock.`}),`\n`,_jsxs(Table,{children:[_jsx(_components.thead,{children:_jsxs(_components.tr,{children:[_jsx(_components.th,{children:`Tile`}),_jsx(_components.th,{children:`Covers`})]})}),_jsxs(_components.tbody,{children:[_jsxs(_components.tr,{children:[_jsx(_components.td,{children:_jsx(_components.strong,{children:`Today`})}),_jsx(_components.td,{children:`Midnight until now. It isn’t a full day.`})]}),_jsxs(_components.tr,{children:[_jsx(_components.td,{children:_jsx(_components.strong,{children:`Yesterday`})}),_jsx(_components.td,{children:`All of yesterday.`})]}),_jsxs(_components.tr,{children:[_jsx(_components.td,{children:_jsx(_components.strong,{children:`Month to date`})}),_jsx(_components.td,{children:`The 1st of this month until now.`})]}),_jsxs(_components.tr,{children:[_jsx(_components.td,{children:_jsx(_components.strong,{children:`This month`})}),_jsxs(_components.td,{children:[`SourceDock’s `,_jsx(_components.a,{href:`/operate/sales-forecast`,children:`forecast`}),` for the whole month. You can switch it to `,_jsx(_components.strong,{children:`This year`}),`.`]})]}),_jsxs(_components.tr,{children:[_jsx(_components.td,{children:_jsx(_components.strong,{children:`Last month`})}),_jsx(_components.td,{children:`All of last month.`})]}),_jsxs(_components.tr,{children:[_jsx(_components.td,{children:_jsx(_components.strong,{children:`YTD`})}),_jsx(_components.td,{children:`January 1 until today. If your first order in SourceDock is later, it starts on that day.`})]}),_jsxs(_components.tr,{children:[_jsx(_components.td,{children:_jsx(_components.strong,{children:`Custom`})}),_jsx(_components.td,{children:`The days you pick.`})]})]})]}),`\n`,_jsx(Frame,{caption:`Whole demo store: the Month to date tile, seen on Nov 7. Notice the dates read Nov 1-7.`,children:_jsx(OptimizedImage,{src:`https://mintcdn.com/sourcedock/K8Z_oIZyuLOpEXsz/images/deep-dives/sales-numbers/03-store-month-to-date-tile.png?fit=max\u0026auto=format\u0026n=K8Z_oIZyuLOpEXsz\u0026q=85\u0026s=4305175e5816355c91892ca8a0954d07`,alt:`The Month to date tile dated Nov 1-7: Sales $146.00, Orders / Units 7 / 7, Refunds $12.00, Promo $0.00, Ad spend -$12.00 est., Amazon fees -$51.00, COGS -$45.50, Gross profit $49.50 est., Net profit $20.50 est., Margin / ROI 14.0% / 45.0%, and More.`,\"data-og-width\":`902`,width:`902`,\"data-og-height\":`786`,height:`786`,\"data-path\":`images/deep-dives/sales-numbers/03-store-month-to-date-tile.png`,\"data-optimize\":`true`,\"data-opv\":`3`,srcset:`https://mintcdn.com/sourcedock/K8Z_oIZyuLOpEXsz/images/deep-dives/sales-numbers/03-store-month-to-date-tile.png?w=280\u0026fit=max\u0026auto=format\u0026n=K8Z_oIZyuLOpEXsz\u0026q=85\u0026s=b6f7798b4e293f3e02f45f6fa3000c78 280w, https://mintcdn.com/sourcedock/K8Z_oIZyuLOpEXsz/images/deep-dives/sales-numbers/03-store-month-to-date-tile.png?w=560\u0026fit=max\u0026auto=format\u0026n=K8Z_oIZyuLOpEXsz\u0026q=85\u0026s=57afe88ec8869cb11e8d32eeaaff1c2a 560w, https://mintcdn.com/sourcedock/K8Z_oIZyuLOpEXsz/images/deep-dives/sales-numbers/03-store-month-to-date-tile.png?w=840\u0026fit=max\u0026auto=format\u0026n=K8Z_oIZyuLOpEXsz\u0026q=85\u0026s=520e3780e80805f454675a5987d9d1ba 840w, https://mintcdn.com/sourcedock/K8Z_oIZyuLOpEXsz/images/deep-dives/sales-numbers/03-store-month-to-date-tile.png?w=1100\u0026fit=max\u0026auto=format\u0026n=K8Z_oIZyuLOpEXsz\u0026q=85\u0026s=8059d7bf12475bb8e14b50b8e11964ce 1100w, https://mintcdn.com/sourcedock/K8Z_oIZyuLOpEXsz/images/deep-dives/sales-numbers/03-store-month-to-date-tile.png?w=1650\u0026fit=max\u0026auto=format\u0026n=K8Z_oIZyuLOpEXsz\u0026q=85\u0026s=83f7b83f35445055c043e0aba4c73f64 1650w, https://mintcdn.com/sourcedock/K8Z_oIZyuLOpEXsz/images/deep-dives/sales-numbers/03-store-month-to-date-tile.png?w=2500\u0026fit=max\u0026auto=format\u0026n=K8Z_oIZyuLOpEXsz\u0026q=85\u0026s=bc2b112fe4333cb6508acef3679b3c06 2500w`})}),`\n`,_jsxs(_components.p,{children:[`Watch it: `,_jsx(_components.a,{href:`/academy/sales-and-expenses`,children:`Sales and expenses`}),`.`]}),`\n`,_jsx(Heading,{level:`2`,id:`more-details`,children:`More details`}),`\n`,_jsxs(AccordionGroup,{children:[_jsxs(Accordion,{title:`The top of the page`,id:`the-top-of-the-page`,children:[_jsxs(_components.p,{children:[`Under the title you see `,_jsx(_components.strong,{children:`Last sync`}),` and `,_jsx(_components.strong,{children:`Next sync`}),`. Those two times use your computer’s clock. The page first opens on `,_jsx(_components.strong,{children:`Month to date`}),`. After that, it opens on the last period you picked.`]}),_jsx(Frame,{caption:`Whole demo store: the top of the Sales page. Notice Last sync and Next sync under the title, and Custom with two day boxes above the tiles.`,children:_jsx(OptimizedImage,{src:`https://mintcdn.com/sourcedock/K8Z_oIZyuLOpEXsz/images/deep-dives/sales-numbers/01-store-header.png?fit=max\u0026auto=format\u0026n=K8Z_oIZyuLOpEXsz\u0026q=85\u0026s=a402707e356a2b727fbafa45fdfb79e8`,alt:`The title Sales with Last sync Nov 7th, 9:00 PM ET · Next sync 9:30 PM ET, and below it Custom, Any date to Any date, and a three-dot menu on the right.`,\"data-og-width\":`2768`,width:`2768`,\"data-og-height\":`192`,height:`192`,\"data-path\":`images/deep-dives/sales-numbers/01-store-header.png`,\"data-optimize\":`true`,\"data-opv\":`3`,srcset:`https://mintcdn.com/sourcedock/K8Z_oIZyuLOpEXsz/images/deep-dives/sales-numbers/01-store-header.png?w=280\u0026fit=max\u0026auto=format\u0026n=K8Z_oIZyuLOpEXsz\u0026q=85\u0026s=6784a07fbf2f066cc58fde992ba3c334 280w, https://mintcdn.com/sourcedock/K8Z_oIZyuLOpEXsz/images/deep-dives/sales-numbers/01-store-header.png?w=560\u0026fit=max\u0026auto=format\u0026n=K8Z_oIZyuLOpEXsz\u0026q=85\u0026s=d125fea40a47cdcf64fc978fc04c9eac 560w, https://mintcdn.com/sourcedock/K8Z_oIZyuLOpEXsz/images/deep-dives/sales-numbers/01-store-header.png?w=840\u0026fit=max\u0026auto=format\u0026n=K8Z_oIZyuLOpEXsz\u0026q=85\u0026s=69c577dd5a1f4a07a39705b955344c00 840w, https://mintcdn.com/sourcedock/K8Z_oIZyuLOpEXsz/images/deep-dives/sales-numbers/01-store-header.png?w=1100\u0026fit=max\u0026auto=format\u0026n=K8Z_oIZyuLOpEXsz\u0026q=85\u0026s=a81e22182c0c47ae367a12630b27aae0 1100w, https://mintcdn.com/sourcedock/K8Z_oIZyuLOpEXsz/images/deep-dives/sales-numbers/01-store-header.png?w=1650\u0026fit=max\u0026auto=format\u0026n=K8Z_oIZyuLOpEXsz\u0026q=85\u0026s=d7118b47bf0544313132ad04d80e6779 1650w, https://mintcdn.com/sourcedock/K8Z_oIZyuLOpEXsz/images/deep-dives/sales-numbers/01-store-header.png?w=2500\u0026fit=max\u0026auto=format\u0026n=K8Z_oIZyuLOpEXsz\u0026q=85\u0026s=b722f4e37d58cc080ed137667bdb02f7 2500w`})})]}),_jsxs(Accordion,{title:`A new store`,id:`a-new-store`,children:[_jsxs(_components.p,{children:[`With no Amazon store, the page says `,_jsx(_components.strong,{children:`Connect your Amazon store to see your sales.`}),` with a `,_jsx(_components.strong,{children:`Connect Amazon`}),` button.`]}),_jsxs(_components.p,{children:[`Before the first pull, the top says `,_jsx(_components.strong,{children:`figures pending`}),`. Until that pull loads your orders, every money figure is a dash. `,_jsx(_components.strong,{children:`Pulling your sales history`}),` shows while SourceDock loads your past orders.`]})]}),_jsxs(Accordion,{title:`Pick your own days`,id:`pick-your-own-days`,children:[_jsxs(_components.p,{children:[`Pick a `,_jsx(_components.strong,{children:`Start day`}),` and an `,_jsx(_components.strong,{children:`End day`}),` above the tiles. A `,_jsx(_components.strong,{children:`Custom`}),` tile shows up. It can cover up to 366 days.`]}),_jsxs(Table,{children:[_jsx(_components.thead,{children:_jsxs(_components.tr,{children:[_jsx(_components.th,{children:`The page says`}),_jsx(_components.th,{children:`Why`})]})}),_jsxs(_components.tbody,{children:[_jsxs(_components.tr,{children:[_jsx(_components.td,{children:_jsx(_components.strong,{children:`Pick one year or less.`})}),_jsx(_components.td,{children:`Your days are longer than that.`})]}),_jsxs(_components.tr,{children:[_jsx(_components.td,{children:_jsx(_components.strong,{children:`The start day is after the end day.`})}),_jsx(_components.td,{children:`Swap them.`})]}),_jsxs(_components.tr,{children:[_jsx(_components.td,{children:_jsx(_components.strong,{children:`Pick days up to today.`})}),_jsx(_components.td,{children:`A day is in the future.`})]}),_jsxs(_components.tr,{children:[_jsx(_components.td,{children:_jsx(_components.strong,{children:`SourceDock is still loading this store’s orders. Pick days once it is done.`})}),_jsx(_components.td,{children:`The first pull isn’t done.`})]})]})]}),_jsx(_components.p,{children:`If you start before your first order day, the tile runs from that first day. The start box shows the new day.`})]}),_jsxs(Accordion,{title:`Choose what the tiles show`,id:`choose-what-the-tiles-show`,children:[_jsxs(_components.p,{children:[`Click `,_jsx(_components.strong,{children:`⋯`}),` above the tiles. The menu says `,_jsx(_components.strong,{children:`Show on tiles`}),`. Every line starts on. `,_jsx(_components.strong,{children:`Show all`}),` turns them all back on. `,_jsx(_components.strong,{children:`Sales`}),`, the big number, always stays.`]}),_jsx(Frame,{caption:`Whole demo store: the ⋯ menu above the tiles. Notice every line starts ticked, and Show all sits at the bottom.`,children:_jsx(OptimizedImage,{src:`https://mintcdn.com/sourcedock/K8Z_oIZyuLOpEXsz/images/deep-dives/sales-numbers/02-store-show-on-tiles.png?fit=max\u0026auto=format\u0026n=K8Z_oIZyuLOpEXsz\u0026q=85\u0026s=a65cfa32e84115375a3cc22133352187`,alt:`A menu titled Show on tiles with ticks beside Orders / Units, Refunds, Promo, Ad spend, Amazon fees, COGS, Gross profit, Net profit and Margin / ROI, and Show all at the bottom.`,\"data-og-width\":`400`,width:`400`,\"data-og-height\":`882`,height:`882`,\"data-path\":`images/deep-dives/sales-numbers/02-store-show-on-tiles.png`,\"data-optimize\":`true`,\"data-opv\":`3`,srcset:`https://mintcdn.com/sourcedock/K8Z_oIZyuLOpEXsz/images/deep-dives/sales-numbers/02-store-show-on-tiles.png?w=280\u0026fit=max\u0026auto=format\u0026n=K8Z_oIZyuLOpEXsz\u0026q=85\u0026s=cc87af7236c7c9eaa0967426c5dba363 280w, https://mintcdn.com/sourcedock/K8Z_oIZyuLOpEXsz/images/deep-dives/sales-numbers/02-store-show-on-tiles.png?w=560\u0026fit=max\u0026auto=format\u0026n=K8Z_oIZyuLOpEXsz\u0026q=85\u0026s=e69f071aacad0e2a6cea004a52a4f227 560w, https://mintcdn.com/sourcedock/K8Z_oIZyuLOpEXsz/images/deep-dives/sales-numbers/02-store-show-on-tiles.png?w=840\u0026fit=max\u0026auto=format\u0026n=K8Z_oIZyuLOpEXsz\u0026q=85\u0026s=1cf8efe430fb32e377bab830ede3c01e 840w, https://mintcdn.com/sourcedock/K8Z_oIZyuLOpEXsz/images/deep-dives/sales-numbers/02-store-show-on-tiles.png?w=1100\u0026fit=max\u0026auto=format\u0026n=K8Z_oIZyuLOpEXsz\u0026q=85\u0026s=cc8a356376cf7636891e12be9b148a8a 1100w, https://mintcdn.com/sourcedock/K8Z_oIZyuLOpEXsz/images/deep-dives/sales-numbers/02-store-show-on-tiles.png?w=1650\u0026fit=max\u0026auto=format\u0026n=K8Z_oIZyuLOpEXsz\u0026q=85\u0026s=0e687e07f7e80e83ab6ff26b7cf3986e 1650w, https://mintcdn.com/sourcedock/K8Z_oIZyuLOpEXsz/images/deep-dives/sales-numbers/02-store-show-on-tiles.png?w=2500\u0026fit=max\u0026auto=format\u0026n=K8Z_oIZyuLOpEXsz\u0026q=85\u0026s=296be037a78f940b1d7f771139405ddc 2500w`})})]}),_jsxs(Accordion,{title:`The More box`,id:`the-more-box`,children:[_jsxs(_components.p,{children:[_jsx(_components.strong,{children:`More`}),` on a tile opens a small box. It shows what the tile leaves out. Its foot gives the order count and `,_jsx(_components.strong,{children:`Full ledger →`}),`.`]}),_jsx(Frame,{caption:`Whole demo store: More, opened on the Month to date tile. Notice the foot: 7 orders, then Full ledger →.`,children:_jsx(OptimizedImage,{src:`https://mintcdn.com/sourcedock/K8Z_oIZyuLOpEXsz/images/deep-dives/sales-numbers/04-store-month-to-date-more.png?fit=max\u0026auto=format\u0026n=K8Z_oIZyuLOpEXsz\u0026q=85\u0026s=8fb0c7e581bd74e12bac9c2d20b10812`,alt:`A small box titled Month to date, Nov 1-7: Expenses -$29.00, Estimated payout $95.00, TACOS 8.2% est., % Refunds 0.0%, and at the foot 7 orders and Full ledger.`,\"data-og-width\":`600`,width:`600`,\"data-og-height\":`402`,height:`402`,\"data-path\":`images/deep-dives/sales-numbers/04-store-month-to-date-more.png`,\"data-optimize\":`true`,\"data-opv\":`3`,srcset:`https://mintcdn.com/sourcedock/K8Z_oIZyuLOpEXsz/images/deep-dives/sales-numbers/04-store-month-to-date-more.png?w=280\u0026fit=max\u0026auto=format\u0026n=K8Z_oIZyuLOpEXsz\u0026q=85\u0026s=6e584852a12e567ad50dcf0d11172ab5 280w, https://mintcdn.com/sourcedock/K8Z_oIZyuLOpEXsz/images/deep-dives/sales-numbers/04-store-month-to-date-more.png?w=560\u0026fit=max\u0026auto=format\u0026n=K8Z_oIZyuLOpEXsz\u0026q=85\u0026s=9d23eeaaddaf76dc1967679a9fb8c76a 560w, https://mintcdn.com/sourcedock/K8Z_oIZyuLOpEXsz/images/deep-dives/sales-numbers/04-store-month-to-date-more.png?w=840\u0026fit=max\u0026auto=format\u0026n=K8Z_oIZyuLOpEXsz\u0026q=85\u0026s=6e63207dfb67aa0273a70a540371009a 840w, https://mintcdn.com/sourcedock/K8Z_oIZyuLOpEXsz/images/deep-dives/sales-numbers/04-store-month-to-date-more.png?w=1100\u0026fit=max\u0026auto=format\u0026n=K8Z_oIZyuLOpEXsz\u0026q=85\u0026s=ac271cea4895c7daeac0a92131b6c42f 1100w, https://mintcdn.com/sourcedock/K8Z_oIZyuLOpEXsz/images/deep-dives/sales-numbers/04-store-month-to-date-more.png?w=1650\u0026fit=max\u0026auto=format\u0026n=K8Z_oIZyuLOpEXsz\u0026q=85\u0026s=1f70eed650f549ef52ad86450274a5df 1650w, https://mintcdn.com/sourcedock/K8Z_oIZyuLOpEXsz/images/deep-dives/sales-numbers/04-store-month-to-date-more.png?w=2500\u0026fit=max\u0026auto=format\u0026n=K8Z_oIZyuLOpEXsz\u0026q=85\u0026s=78f3b5c263be1be71ba5909668476dc3 2500w`})}),_jsxs(_components.ul,{children:[`\n`,_jsxs(_components.li,{children:[_jsx(_components.strong,{children:`Expenses`}),`: the costs you added on `,_jsx(_components.a,{href:`/operate/expenses`,children:`Expenses`}),`.`]}),`\n`,_jsxs(_components.li,{children:[_jsx(_components.strong,{children:`Estimated payout`}),`: what Amazon pays you for this period. Cost of goods, ads paid by card, and your expenses aren’t in it.`]}),`\n`,_jsxs(_components.li,{children:[_jsx(_components.strong,{children:`TACOS`}),`: ad spend divided by all sales, not only sales the ads brought in. It means Total Advertising Cost of Sales. Lower is better.`]}),`\n`,_jsxs(_components.li,{children:[_jsx(_components.strong,{children:`% Refunds`}),`: units refunded divided by units sold.`]}),`\n`]})]})]})]})}function MDXContent(props={}){const{wrapper:MDXLayout}={..._provideComponents(),...props.components};return MDXLayout?_jsx(MDXLayout,{...props,children:_jsx(_createMdxContent,{...props})}):_createMdxContent(props)}return{default:MDXContent};function _missingMdxReference(id,component){throw new Error(`Expected `+(component?`component`:`object`)+\" `\"+id+\"` to be defined: you likely forgot to import, pass, or provide it.\")}","frontmatter":{},"scope":{"config":{},"pageMetadata":{"title":"The Sales tiles","sidebarTitle":"The tiles","description":"3 min read · Each tile is one time period. Pick a tile, pick your own days, and choose what the tiles show.","icon":"layout-grid","href":"/operate/sales-tiles"}}},"mdxSourceWithNoJs":null},"mdxExtracts":{"tableOfContents":[{"title":"In short","slug":"in-short","depth":2,"children":[]},{"title":"More details","slug":"more-details","depth":2,"children":[]}],"codeExamples":{}},"jsLinks":[],"subdomain":"sourcedock","siteName":"SourceDock","title":"The Sales tiles - SourceDock","navMaps":{"firstHrefInVersion":{},"firstHrefInLanguage":{}},"lastModified":"2026-11-08T03:20:28.035Z","originalFileLocation":"operate/sales-tiles.mdx"},"headHtml":"\u003cscript data-mint-head>(function(){var d=document.documentElement,p=null;if(!p){try{p=localStorage.getItem(\"isDarkMode\")}catch(e){}if(p==='true')p='dark';else if(p==='false')p='light';if(p!=='light'\u0026\u0026p!=='dark'\u0026\u0026p!=='system')p=\"dark\"}var r=p==='system'?(matchMedia(\"(prefers-color-scheme: dark)\").matches?'dark':'light'):p;d.classList.remove(r==='dark'?'light':'dark');d.classList.add(r);d.setAttribute(\"data-theme-preference\",p)})();\u003c/script>\u003cmeta data-mint-head name=\"description\" content=\"3 min read · Each tile is one time period. Pick a tile, pick your own days, and choose what the tiles show.\">\u003cmeta data-mint-head name=\"application-name\" content=\"SourceDock\">\u003cmeta data-mint-head name=\"generator\" content=\"Mintlify\">\u003clink data-mint-head rel=\"apple-touch-icon\" type=\"image/png\" sizes=\"180x180\" href=\"https://mintcdn.com/sourcedock/PvFEadQJVbcHct-s/favicon.png?fit=max\u0026amp;auto=format\u0026amp;n=PvFEadQJVbcHct-s\u0026amp;q=85\u0026amp;s=b2a8ed72213fc5eb8082f24866be78d9\">\u003clink data-mint-head rel=\"icon\" type=\"image/png\" sizes=\"32x32\" href=\"https://mintcdn.com/sourcedock/PvFEadQJVbcHct-s/favicon.png?fit=max\u0026amp;auto=format\u0026amp;n=PvFEadQJVbcHct-s\u0026amp;q=85\u0026amp;s=b2a8ed72213fc5eb8082f24866be78d9\">\u003clink data-mint-head rel=\"icon\" type=\"image/png\" sizes=\"16x16\" href=\"https://mintcdn.com/sourcedock/PvFEadQJVbcHct-s/favicon.png?fit=max\u0026amp;auto=format\u0026amp;n=PvFEadQJVbcHct-s\u0026amp;q=85\u0026amp;s=b2a8ed72213fc5eb8082f24866be78d9\">\u003clink data-mint-head rel=\"shortcut icon\" type=\"image/png\" href=\"https://mintcdn.com/sourcedock/PvFEadQJVbcHct-s/favicon.png?fit=max\u0026amp;auto=format\u0026amp;n=PvFEadQJVbcHct-s\u0026amp;q=85\u0026amp;s=b2a8ed72213fc5eb8082f24866be78d9\">\u003cmeta data-mint-head property=\"og:title\" content=\"The Sales tiles - SourceDock\">\u003cmeta data-mint-head property=\"og:description\" content=\"3 min read · Each tile is one time period. Pick a tile, pick your own days, and choose what the tiles show.\">\u003cmeta data-mint-head property=\"og:site_name\" content=\"SourceDock\">\u003cmeta data-mint-head property=\"og:url\" content=\"https://docs.sourcedock.io/operate/sales-tiles\">\u003cmeta data-mint-head property=\"og:type\" content=\"website\">\u003cmeta data-mint-head property=\"og:image\" content=\"https://sourcedock.mintlify.site/_mintlify/api/og/v2?division=Sales\u0026amp;title=The+Sales+tiles\u0026amp;description=3+min+read+%C2%B7+Each+tile+is+one+time+period.+Pick+a+tile%2C+pick+your+own+days%2C+and+choose+what+the+tiles+show.\u0026amp;theme=a9389db1756ac6faaddb7eff\u0026amp;signature=171bc9e84a2f049c4e3ebb4cdbd94372ee435e3075419a2ac1cf5e72d733521f\">\u003cmeta data-mint-head property=\"og:image:width\" content=\"1200\">\u003cmeta data-mint-head property=\"og:image:height\" content=\"630\">\u003cmeta data-mint-head name=\"twitter:card\" content=\"summary_large_image\">\u003cmeta data-mint-head name=\"twitter:title\" content=\"The Sales tiles - SourceDock\">\u003cmeta data-mint-head name=\"twitter:description\" content=\"3 min read · Each tile is one time period. Pick a tile, pick your own days, and choose what the tiles show.\">\u003cmeta data-mint-head name=\"twitter:image\" content=\"https://sourcedock.mintlify.site/_mintlify/api/og/v2?division=Sales\u0026amp;title=The+Sales+tiles\u0026amp;description=3+min+read+%C2%B7+Each+tile+is+one+time+period.+Pick+a+tile%2C+pick+your+own+days%2C+and+choose+what+the+tiles+show.\u0026amp;theme=a9389db1756ac6faaddb7eff\u0026amp;signature=171bc9e84a2f049c4e3ebb4cdbd94372ee435e3075419a2ac1cf5e72d733521f\">\u003cmeta data-mint-head name=\"twitter:image:width\" content=\"1200\">\u003cmeta data-mint-head name=\"twitter:image:height\" content=\"630\">\u003cmeta data-mint-head name=\"msapplication-config\" content=\"https://mintlify.s3.us-west-1.amazonaws.com/sourcedock/_generated/favicon/browserconfig.xml?v=3\">\u003cmeta data-mint-head name=\"apple-mobile-web-app-title\" content=\"SourceDock\">\u003cmeta data-mint-head name=\"msapplication-TileColor\" content=\"#EA580C\">\u003clink data-mint-head rel=\"canonical\" href=\"https://docs.sourcedock.io/operate/sales-tiles\">\u003clink data-mint-head rel=\"alternate\" type=\"application/xml\" href=\"/sitemap.xml\">\u003clink data-mint-head rel=\"alternate\" type=\"text/markdown\" href=\"/operate/sales-tiles.md\">\u003cscript data-mint-head type=\"application/ld+json\">{\"@context\":\"https://schema.org\",\"@graph\":[{\"@type\":\"Organization\",\"@id\":\"https://docs.sourcedock.io/#organization\",\"name\":\"SourceDock\",\"url\":\"https://docs.sourcedock.io\",\"logo\":{\"@type\":\"ImageObject\",\"url\":\"https://mintcdn.com/sourcedock/qOyT6VleObj7HrsZ/logo/light.svg?fit=max\u0026auto=format\u0026n=qOyT6VleObj7HrsZ\u0026q=85\u0026s=fac497db707183ccf027093f15f21cd7\"}},{\"@type\":\"WebSite\",\"@id\":\"https://docs.sourcedock.io#website\",\"name\":\"SourceDock\",\"url\":\"https://docs.sourcedock.io\",\"publisher\":{\"@id\":\"https://docs.sourcedock.io/#organization\"}},{\"@type\":\"WebPage\",\"@id\":\"https://docs.sourcedock.io/operate/sales-tiles#webpage\",\"url\":\"https://docs.sourcedock.io/operate/sales-tiles\",\"name\":\"The Sales tiles\",\"description\":\"3 min read · Each tile is one time period. Pick a tile, pick your own days, and choose what the tiles show.\",\"dateModified\":\"2026-11-08T03:20:28.035Z\",\"isPartOf\":{\"@id\":\"https://docs.sourcedock.io#website\"},\"breadcrumb\":{\"@id\":\"https://docs.sourcedock.io/operate/sales-tiles#breadcrumb\"}},{\"@type\":\"BreadcrumbList\",\"@id\":\"https://docs.sourcedock.io/operate/sales-tiles#breadcrumb\",\"itemListElement\":[{\"@type\":\"ListItem\",\"position\":1,\"name\":\"Operate\",\"item\":\"https://docs.sourcedock.io/operate/record-a-purchase\"},{\"@type\":\"ListItem\",\"position\":2,\"name\":\"Sales\",\"item\":\"https://docs.sourcedock.io/operate/sales\"},{\"@type\":\"ListItem\",\"position\":3,\"name\":\"The Sales tiles\",\"item\":\"https://docs.sourcedock.io/operate/sales-tiles\"}]},{\"@type\":[\"Article\",\"TechArticle\"],\"@id\":\"https://docs.sourcedock.io/operate/sales-tiles#article\",\"headline\":\"The Sales tiles\",\"name\":\"The Sales tiles\",\"description\":\"3 min read · Each tile is one time period. Pick a tile, pick your own days, and choose what the tiles show.\",\"url\":\"https://docs.sourcedock.io/operate/sales-tiles\",\"mainEntityOfPage\":{\"@id\":\"https://docs.sourcedock.io/operate/sales-tiles#webpage\"},\"dateModified\":\"2026-11-08T03:20:28.035Z\",\"publisher\":{\"@id\":\"https://docs.sourcedock.io/#organization\"},\"isPartOf\":{\"@id\":\"https://docs.sourcedock.io#website\"}}]}\u003c/script>\u003cscript data-mint-head type=\"application/ld+json\">{\"@context\":\"https://schema.org\",\"@type\":\"WebSite\",\"name\":\"SourceDock\",\"publisher\":{\"@type\":\"Organization\",\"name\":\"SourceDock\"},\"provider\":{\"@type\":\"Organization\",\"name\":\"Mintlify\",\"url\":\"https://mintlify.com\"}}\u003c/script>","agentPointerHref":"/operate/sales-tiles.md","siteName":"SourceDock","nav":{"global":null,"tabs":[{"tab":"Docs","groups":[{"group":"Get started","pages":[{"title":"Welcome to SourceDock","icon":"house","href":""},{"title":"Quickstart","icon":"rocket","href":"/get-started/quickstart"},{"group":"Setup","pages":[{"title":"Setup: your first day","icon":"list-checks","href":"/get-started/setup"},{"title":"Make your SourceDock account","sidebarTitle":"Make your account","icon":"user-plus","href":"/get-started/setup-sign-up"},{"title":"Start your 14-day trial","sidebarTitle":"Start your trial","icon":"play","href":"/get-started/setup-trial"},{"title":"Setup: connect Amazon","sidebarTitle":"Connect Amazon","icon":"link","href":"/get-started/setup-connect-amazon"},{"title":"Setup: import your history","sidebarTitle":"Import your history","icon":"history","href":"/get-started/setup-import-history"},{"title":"Setup: add your buy costs","sidebarTitle":"Add your buy costs","icon":"file-spreadsheet","href":"/get-started/setup-costs"},{"title":"Setup: review and import","sidebarTitle":"Review and import","icon":"circle-check","href":"/get-started/setup-review"},{"title":"Setup: units you shipped yourself","sidebarTitle":"Units you shipped yourself","icon":"truck","href":"/get-started/setup-shipped-yourself"},{"title":"Leave setup and come back","sidebarTitle":"Leave and come back","icon":"corner-up-left","href":"/get-started/setup-leave-and-return"},{"title":"Setup problems","icon":"triangle-alert","href":"/get-started/setup-problems"}]},{"title":"Connections","icon":"cable","href":"/get-started/connections"},{"title":"Google Sheets","icon":"sheet","href":"/get-started/google-sheets"},{"group":"Account","pages":[{"title":"Account","icon":"user","href":"/get-started/account"},{"title":"Account security","sidebarTitle":"Security","icon":"shield","href":"/get-started/account-security"},{"title":"Yearly reports for your accountant","sidebarTitle":"Reports","icon":"file-spreadsheet","href":"/get-started/account-reports"},{"title":"What's in a Capital Recovery Report","sidebarTitle":"What's in a report","icon":"table","href":"/get-started/account-report-details"},{"title":"Start your import over, or delete your account","sidebarTitle":"Danger","icon":"triangle-alert","href":"/get-started/account-danger"}]},{"group":"Team members","pages":[{"title":"Team members","icon":"users","href":"/get-started/team"},{"title":"Invite someone to your team","sidebarTitle":"Invite someone","icon":"user-plus","href":"/get-started/team-invite"},{"title":"Accept a team invite","sidebarTitle":"Accept an invite","icon":"mail-check","href":"/get-started/team-accept"},{"title":"What each team role sees","sidebarTitle":"What each role sees","icon":"shield","href":"/get-started/team-roles"},{"title":"Which pages you can share with your team","sidebarTitle":"Which pages you can share","icon":"toggle-right","href":"/get-started/team-pages"},{"title":"Change or remove a team member","sidebarTitle":"Change or remove someone","icon":"user-cog","href":"/get-started/team-change-or-remove"},{"title":"When your plan gets smaller","icon":"user-minus","href":"/get-started/team-plan-changes"}]},{"title":"Turn features on and off","icon":"sliders-horizontal","href":"/get-started/features"},{"group":"Profit and settings","pages":[{"title":"The profit calculator and every setting","sidebarTitle":"Profit and settings","icon":"calculator","href":"/get-started/profit-calculator-and-settings"},{"title":"The bar and the Desk settings","sidebarTitle":"The bar and the Desk","icon":"panel-top","href":"/get-started/settings-bar-and-desk"},{"title":"The Restock reminders card","sidebarTitle":"Restock reminders","icon":"bell-ring","href":"/get-started/settings-restock-reminders"},{"title":"Auto-cancel purchases that never arrive","sidebarTitle":"Purchases that never arrive","icon":"calendar-x","href":"/get-started/settings-auto-cancel"},{"title":"How profit adds up","icon":"calculator","href":"/get-started/profit-how-it-adds-up"},{"title":"Cost settings for profit","sidebarTitle":"Cost settings","icon":"sliders-horizontal","href":"/get-started/profit-cost-settings"},{"title":"Sale price and goals","icon":"target","href":"/get-started/profit-price-and-goals"},{"title":"FBM profit, and what the Vault does differently","sidebarTitle":"FBM and the Vault","icon":"truck","href":"/get-started/profit-fbm-and-vault"}]},{"group":"Phone app","pages":[{"title":"Phone app","icon":"smartphone","href":"/get-started/phone-app"},{"title":"The phone app's bars and shortcuts","sidebarTitle":"Bars and shortcuts","icon":"layout-panel-top","href":"/get-started/phone-app-bars"},{"title":"The Desk on your phone","sidebarTitle":"The Desk","icon":"layout-dashboard","href":"/get-started/phone-app-desk"},{"title":"Look up a product on your phone","sidebarTitle":"Look up a product","icon":"scan-barcode","href":"/get-started/phone-app-look-up"},{"title":"Read a product's profit on your phone","sidebarTitle":"Read a product's profit","icon":"calculator","href":"/get-started/phone-app-profit"},{"title":"Photos and receipts on your phone","sidebarTitle":"Photos and receipts","icon":"camera","href":"/get-started/phone-app-photos"},{"title":"Lists and detail sheets on your phone","sidebarTitle":"Lists and detail sheets","icon":"list","href":"/get-started/phone-app-lists"},{"title":"Alerts on your phone","icon":"bell-ring","href":"/get-started/phone-app-alerts"}]},{"group":"Plans and billing","pages":[{"title":"Plans and billing","icon":"credit-card","href":"/get-started/billing"},{"title":"What each SourceDock plan has","sidebarTitle":"What each plan has","icon":"layers","href":"/get-started/billing-plans"},{"title":"Your 14-day free trial","sidebarTitle":"Your free trial","icon":"calendar-clock","href":"/get-started/billing-trial"},{"title":"Trial checks and Start my plan","sidebarTitle":"Trial checks and Start my plan","icon":"gauge","href":"/get-started/billing-start-my-plan"},{"title":"Codes on your SourceDock plan","sidebarTitle":"Codes","icon":"ticket","href":"/get-started/billing-codes"},{"title":"The Billing page","icon":"receipt","href":"/get-started/billing-page"},{"title":"Switch plans or cancel","sidebarTitle":"Switch or cancel","icon":"repeat","href":"/get-started/billing-switch-or-cancel"},{"title":"When a payment fails","sidebarTitle":"A failed payment","icon":"credit-card","href":"/get-started/billing-failed-payment"},{"title":"What happens to your data","icon":"database","href":"/get-started/billing-your-data"}]}]},{"group":"Source","pages":[{"group":"Gate Scanner","pages":[{"title":"Gate Scanner","icon":"scan-line","href":"/source/gate-scanner"},{"title":"Add your ASINs to the Gate Scanner","sidebarTitle":"Add your ASINs","icon":"list-plus","href":"/source/gate-scanner-add-asins"},{"title":"Run a Gate Scanner scan","sidebarTitle":"Run a scan","icon":"play","href":"/source/gate-scanner-run"},{"title":"What each Gate Scanner verdict means","sidebarTitle":"What each verdict means","icon":"shield-check","href":"/source/gate-scanner-verdicts"},{"title":"Read the Gate Scanner results","sidebarTitle":"Read the results","icon":"table","href":"/source/gate-scanner-results"},{"title":"Save Gate Scanner results to your Vault","sidebarTitle":"Save to your Vault","icon":"archive","href":"/source/gate-scanner-save"},{"title":"Verify a product with the extension","sidebarTitle":"Verify with the extension","icon":"badge-check","href":"/source/gate-scanner-verify"},{"title":"Export a scan, or open it in Keepa","sidebarTitle":"Export and Open in Keepa","icon":"download","href":"/source/gate-scanner-export"},{"title":"Recent scans in the Gate Scanner","sidebarTitle":"Recent scans","icon":"history","href":"/source/gate-scanner-recent"},{"title":"Gate Scanner free checks and plans","sidebarTitle":"Free checks and plans","icon":"gauge","href":"/source/gate-scanner-limits"},{"title":"When a Gate Scanner scan stops or fails","sidebarTitle":"When a scan stops or fails","icon":"triangle-alert","href":"/source/gate-scanner-problems"}]},{"group":"Vault","pages":[{"title":"Vault","icon":"vault","href":"/source/prospect-vault"},{"title":"Add a product to your Vault","sidebarTitle":"Add a product","icon":"plus","href":"/source/vault-add"},{"title":"Read your Vault list","sidebarTitle":"Read the list","icon":"table","href":"/source/vault-list"},{"title":"How the Vault works out profit","sidebarTitle":"How profit is worked out","icon":"calculator","href":"/source/vault-profit"},{"title":"FBM in the Vault","sidebarTitle":"FBM and Compare","icon":"truck","href":"/source/vault-fbm"},{"title":"One product in your Vault","sidebarTitle":"One product","icon":"package","href":"/source/vault-one-product"},{"title":"Set an alert on a Vault product","sidebarTitle":"Set an alert","icon":"bell","href":"/source/vault-alerts"},{"title":"Act on many Vault products","sidebarTitle":"Actions and many products","icon":"list-checks","href":"/source/vault-actions"}]},{"group":"Scout","pages":[{"title":"Scout","icon":"telescope","href":"/source/scout"},{"title":"Watch a storefront with Scout","sidebarTitle":"Watch a storefront","icon":"plus","href":"/source/scout-watch"},{"title":"How often Scout checks","sidebarTitle":"How often it checks","icon":"clock","href":"/source/scout-checks"},{"title":"Scout's tiles and storefront cards","sidebarTitle":"Tiles and storefront cards","icon":"layout-grid","href":"/source/scout-tiles-and-cards"},{"title":"Read a Scout find","sidebarTitle":"Read a find","icon":"search","href":"/source/scout-read-a-find"},{"title":"Save or acknowledge Scout finds","sidebarTitle":"Save or acknowledge","icon":"archive","href":"/source/scout-save-and-acknowledge"},{"title":"Search, sort, and filter Scout finds","sidebarTitle":"Search, sort, and filter","icon":"list-filter","href":"/source/scout-filters"},{"title":"Scout notices, export, and plans","sidebarTitle":"Notices, export, and plans","icon":"bell","href":"/source/scout-notify-export-plans"}]}]},{"group":"Operate","pages":[{"title":"Record what you buy, each way","icon":"shopping-cart","href":"/operate/record-a-purchase"},{"title":"Import from Amazon","icon":"import","href":"/operate/import-from-amazon"},{"title":"Your buy sheet","icon":"file-spreadsheet","href":"/operate/buy-sheets"},{"group":"Purchases","pages":[{"title":"Purchases","icon":"shopping-bag","href":"/operate/purchases"},{"title":"The Record purchase sheet","sidebarTitle":"Record a purchase","icon":"clipboard-pen","href":"/operate/purchases-record-sheet"},{"title":"Receipts and box photos","icon":"paperclip","href":"/operate/purchases-receipts"},{"title":"Cost, Expected Profit and Current Profit","sidebarTitle":"Cost and profit","icon":"calculator","href":"/operate/purchases-profit"},{"title":"Move an order along","icon":"route","href":"/operate/purchases-stages"},{"title":"Cancel an order","icon":"circle-x","href":"/operate/purchases-cancel"},{"title":"Write off units that won't sell","sidebarTitle":"Write-offs","icon":"file-x","href":"/operate/purchases-write-offs"},{"title":"Gift cards and split payments","icon":"gift","href":"/operate/gift-cards"},{"title":"Find the right orders","icon":"search","href":"/operate/purchases-find"},{"title":"One order's row","icon":"rows-3","href":"/operate/purchases-rows"},{"title":"Reconcile on Purchases, card by card","sidebarTitle":"Reconcile cards","icon":"list-checks","href":"/operate/purchases-reconcile"}]},{"title":"FBA vs FBM, and orders split across the two","icon":"split","href":"/operate/fba-vs-fbm"},{"group":"Capital Recovery","pages":[{"title":"Capital Recovery","icon":"chart-line","href":"/operate/capital-recovery"},{"title":"The top of Capital Recovery","sidebarTitle":"The top of the page","icon":"gauge","href":"/operate/capital-recovery-top-cards"},{"title":"Where your money sits","icon":"chart-pie","href":"/operate/capital-recovery-breakdown"},{"title":"The Capital Recovery product list","sidebarTitle":"The product list","icon":"list","href":"/operate/capital-recovery-product-list"},{"title":"The Capital Recovery chips","sidebarTitle":"The chips","icon":"list-filter","href":"/operate/capital-recovery-chips"},{"title":"Open a product on Capital Recovery","sidebarTitle":"Open a product","icon":"panel-top-open","href":"/operate/capital-recovery-open-a-product"},{"title":"Units at Amazon","icon":"warehouse","href":"/operate/capital-recovery-units"},{"title":"The side panel and the ledger","icon":"receipt-text","href":"/operate/capital-recovery-ledger"},{"title":"One product, every number","icon":"calculator","href":"/operate/capital-recovery-numbers"},{"title":"A product you bought more than once","sidebarTitle":"Batches","icon":"layers","href":"/operate/capital-recovery-batches"},{"title":"Wallet: your Amazon payouts","sidebarTitle":"Wallet","icon":"wallet","href":"/operate/capital-recovery-wallet"}]},{"title":"Capital Recovery vs Sales","icon":"scale","href":"/operate/capital-recovery-vs-sales"},{"title":"Replans: when a shipment doesn't match the plan","icon":"route","href":"/operate/replans"},{"group":"Sales","pages":[{"title":"Sales","description":"2 min read · Your Amazon orders, fees, ad spend, and profit for today, this month, or any days you pick, with a forecast for the month or the year.","icon":"chart-column","href":"/operate/sales"},{"title":"The Sales tiles","sidebarTitle":"The tiles","icon":"layout-grid","href":"/operate/sales-tiles"},{"title":"How the Sales numbers add up","sidebarTitle":"How the numbers add up","description":"3 min read · One made-up day, line by line, from what buyers paid down to net profit.","icon":"calculator","href":"/operate/sales-how-numbers-add-up"},{"title":"est., dashes and missing costs on Sales","sidebarTitle":"est., dashes and missing costs","icon":"circle-help","href":"/operate/sales-est-and-dashes"},{"title":"The Sales forecast","sidebarTitle":"The forecast","icon":"trending-up","href":"/operate/sales-forecast"},{"title":"The Sales chart and products","sidebarTitle":"The chart and the products","icon":"table","href":"/operate/sales-products"},{"title":"The Sales full ledger","sidebarTitle":"The full ledger","icon":"receipt-text","href":"/operate/sales-ledger"},{"title":"Amazon's fee lines on Sales","sidebarTitle":"Amazon's fee lines","icon":"percent","href":"/operate/sales-fees"},{"title":"Stores on Sales: Canada, Mexico, and All stores","sidebarTitle":"Stores","icon":"globe","href":"/operate/sales-stores"},{"title":"Write-offs and expenses on Sales","sidebarTitle":"Write-offs and expenses","icon":"file-minus","href":"/operate/sales-write-offs"}]},{"group":"Claims","pages":[{"title":"Claims: money Amazon owes you","icon":"scale","href":"/operate/claims"},{"title":"Read a claim card and file it","sidebarTitle":"File a claim","icon":"send","href":"/operate/claims-file"},{"title":"A claim's Details and See details","sidebarTitle":"Details and See details","icon":"file-search","href":"/operate/claims-details"},{"title":"The Issues box: not a claim yet","sidebarTitle":"The Issues box","icon":"hourglass","href":"/operate/claims-issues"},{"title":"How long you have to claim","sidebarTitle":"How long you have","icon":"timer","href":"/operate/claims-time"},{"title":"Every kind of claim: at Amazon and on returns","sidebarTitle":"Claims at Amazon","icon":"package-x","href":"/operate/claims-kinds"},{"title":"Claims on shipments","icon":"package-open","href":"/operate/claims-shipments"},{"title":"Needs a look: claims Amazon's reports can't prove","sidebarTitle":"Needs a look","icon":"eye","href":"/operate/claims-needs-a-look"},{"title":"After you file: Filed claims","sidebarTitle":"After you file","icon":"clock","href":"/operate/claims-filed"},{"title":"When Amazon says no","sidebarTitle":"Denied","icon":"ban","href":"/operate/claims-denied"},{"title":"Paid out: what Amazon paid","sidebarTitle":"Paid out","icon":"badge-dollar-sign","href":"/operate/claims-paid"},{"title":"Not a claim, and a claim you can't find","sidebarTitle":"Not a claim","icon":"circle-help","href":"/operate/claims-not-a-claim"}]},{"group":"Reviews","pages":[{"title":"Reviews","icon":"message-square-quote","href":"/operate/reviews"},{"title":"Start a Reviews campaign","sidebarTitle":"Start a campaign","icon":"play","href":"/operate/reviews-start"},{"title":"Who Reviews asks","sidebarTitle":"Who gets asked","icon":"users","href":"/operate/reviews-who"},{"title":"The Reviews order list","sidebarTitle":"The order list","icon":"list","href":"/operate/reviews-orders"},{"title":"Change a Reviews campaign","sidebarTitle":"Change a campaign","icon":"pencil","href":"/operate/reviews-change"}]},{"group":"Expenses","pages":[{"title":"Expenses","icon":"receipt","href":"/operate/expenses"},{"title":"Add an expense","icon":"plus","href":"/operate/expenses-add"},{"title":"Which day an expense counts","sidebarTitle":"Which day a charge counts","icon":"calendar-days","href":"/operate/expenses-charges"},{"title":"Read the Expenses page","sidebarTitle":"Read the page","icon":"table","href":"/operate/expenses-page"},{"title":"Change, stop, or delete an expense","sidebarTitle":"Change, stop, or delete","icon":"pencil","href":"/operate/expenses-change"},{"title":"Import and export expenses","sidebarTitle":"Import and export","icon":"file-up","href":"/operate/expenses-import-export"},{"title":"Where expenses show up","sidebarTitle":"Where the money shows up","icon":"git-compare","href":"/operate/expenses-on-your-profit"}]}]},{"group":"The desk","pages":[{"group":"Command desk","pages":[{"title":"Command desk","icon":"layout-dashboard","href":"/desk/command-desk"},{"title":"The top of the Desk and its days","sidebarTitle":"The top and the days","icon":"calendar-days","href":"/desk/desk-top"},{"title":"Sales and profit on the Desk","sidebarTitle":"Sales and profit","icon":"chart-column","href":"/desk/desk-sales"},{"title":"Amazon owes you and Capital at work","icon":"wallet","href":"/desk/desk-money"},{"title":"Open alerts and Reorder now","icon":"list-todo","href":"/desk/desk-alerts-and-reorder"},{"title":"The bars across the top","sidebarTitle":"Bars across the top","icon":"panel-top","href":"/desk/desk-bars"},{"title":"Moving around SourceDock","sidebarTitle":"Moving around","icon":"compass","href":"/desk/desk-moving-around"}]},{"group":"Alerts","pages":[{"title":"Alerts","icon":"bell","href":"/desk/alerts"},{"title":"Alerts: Money to claim","sidebarTitle":"Money to claim","icon":"badge-dollar-sign","href":"/desk/alerts-money-to-claim"},{"title":"Alerts: Fix counts","sidebarTitle":"Fix counts","icon":"wrench","href":"/desk/alerts-fix-counts"},{"title":"Alerts: Sell faster","sidebarTitle":"Sell faster","icon":"gauge","href":"/desk/alerts-sell-faster"},{"title":"Alerts: Buy next","sidebarTitle":"Buy next","icon":"shopping-cart","href":"/desk/alerts-buy-next"},{"title":"Alerts: Account health, Early warnings and Feedback","sidebarTitle":"Health, warnings, feedback","icon":"triangle-alert","href":"/desk/alerts-account-and-warnings"},{"title":"Sounds, pop-ups and phone alerts","icon":"bell-ring","href":"/desk/alerts-sounds"},{"title":"Hide an alert, and what the counts mean","sidebarTitle":"Hide and counts","icon":"eye-off","href":"/desk/alerts-hide"}]},{"group":"Account health","pages":[{"title":"Account health","icon":"heart-pulse","href":"/desk/account-health"},{"title":"Account Health Rating and status","sidebarTitle":"Rating and status","icon":"gauge","href":"/desk/health-rating"},{"title":"IP complaints and policy issues","sidebarTitle":"Complaints and policy issues","icon":"shield-alert","href":"/desk/health-complaints"},{"title":"Order rates on Account health","sidebarTitle":"Order rates","icon":"package-check","href":"/desk/health-orders"},{"title":"Account health warnings and alerts","sidebarTitle":"Warnings and alerts","icon":"triangle-alert","href":"/desk/health-warnings"},{"title":"Account health plans and missing numbers","sidebarTitle":"Plans and missing numbers","icon":"circle-help","href":"/desk/health-plans"}]},{"group":"Restock reminders","pages":[{"title":"Restock reminders","icon":"package","href":"/desk/restock-reminders"},{"title":"The Restock reminders card","sidebarTitle":"The settings card","icon":"sliders-horizontal","href":"/desk/restock-settings"},{"title":"When a restock reminder comes","sidebarTitle":"When a reminder comes","icon":"calendar-clock","href":"/desk/restock-when"},{"title":"Where you see restock reminders","sidebarTitle":"Where you see it","icon":"map-pin","href":"/desk/restock-where"},{"title":"Restock emails and phone notices","sidebarTitle":"The email and the phone","icon":"mail","href":"/desk/restock-email-phone"}]}]},{"group":"Reference","pages":[{"title":"Reconcile and Jax","icon":"scale","href":"/reference/reconcile"},{"group":"Chrome extension","pages":[{"title":"Chrome extension","icon":"puzzle","href":"/reference/chrome-extension"},{"title":"Where the panel sits","icon":"panel-right","href":"/reference/chrome-extension-panel"},{"title":"The product row and Alerts","icon":"package","href":"/reference/chrome-extension-product"},{"title":"Quick info","icon":"zap","href":"/reference/chrome-extension-quick-info"},{"title":"Where the sale price comes from","sidebarTitle":"The sale price","icon":"tag","href":"/reference/chrome-extension-sale-price"},{"title":"The profit calculator","icon":"calculator","href":"/reference/chrome-extension-calculator"},{"title":"Each fee, line by line","sidebarTitle":"Each fee","icon":"receipt","href":"/reference/chrome-extension-fees"},{"title":"Switch to FBM","icon":"truck","href":"/reference/chrome-extension-fbm"},{"title":"Offers and Show stock","icon":"users","href":"/reference/chrome-extension-offers"},{"title":"The Buy Box pie and Variations","sidebarTitle":"Buy Box pie and Variations","icon":"chart-pie","href":"/reference/chrome-extension-buy-box-pie"},{"title":"Seller Lookup","icon":"user-search","href":"/reference/chrome-extension-seller-lookup"},{"title":"Find on Amazon","icon":"search","href":"/reference/chrome-extension-find"},{"title":"The extension's Vault tab","sidebarTitle":"Vault tab","icon":"vault","href":"/reference/chrome-extension-vault"},{"title":"The extension's Purchase tab","sidebarTitle":"Purchase tab","icon":"shopping-cart","href":"/reference/chrome-extension-purchase"},{"title":"The Account tab and Settings","sidebarTitle":"Account and Settings","icon":"settings","href":"/reference/chrome-extension-settings"},{"title":"Verify and Check now","icon":"shield-check","href":"/reference/chrome-extension-verify"}]},{"title":"Glossary, A to L","sidebarTitle":"Glossary, A to L","icon":"book-open","href":"/reference/glossary"},{"title":"Glossary, M to Z","sidebarTitle":"Glossary, M to Z","icon":"book-open","href":"/reference/glossary-m-z"}]},{"group":"Guides","pages":[{"title":"How SourceDock fits together","icon":"route","href":"/guides/how-sourcedock-fits-together"},{"title":"Where each setting lives","icon":"sliders-horizontal","href":"/guides/settings-map"},{"title":"A regular day in SourceDock","icon":"sun","href":"/guides/a-regular-day"},{"title":"Vault or Profit calculator?","icon":"calculator","href":"/guides/vault-vs-profit-calculator"}]}]},{"tab":"Academy","icon":"graduation-cap","pages":[{"title":"Academy","href":"/academy"}]}]},"basePath":"","title":"The Sales tiles - SourceDock","deploymentId":"dpl_DyXGnKeCjZyA3sUdfMJ7FjkdBefg","buildId":"dpl_DyXGnKeCjZyA3sUdfMJ7FjkdBefg","dynamics":["07c022d89b","a74be98ba7"],"chunks":["Frame-D0FT0qQs.js","DynamicMarkdown-CQM9Bhbv.js","zoom-image-lightbox-BQ4tbj_9.js","lightbox-handle-r17bVUz3.js"]}