

In short
The This month tile guesses how the whole month will end. It wears a Forecast badge. It adds your full days so far to their daily average for each day left. Today is left out of the average, since a part day would pull it down. Say it’s October 4, and you’ve had 3 full days of $100.00 in sales. October has 31 days, so 28 are left. $300.00 + (28 × $100.00) = $3,100.00 forecast.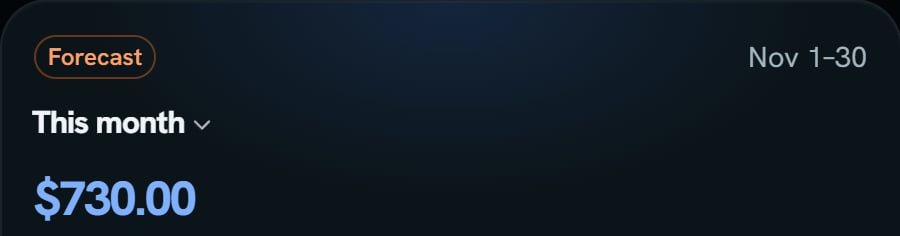
Whole demo store: the top of the This month tile. Notice the Forecast badge and the dates Nov 1-30, the whole month.
More details
Switch to This year
Switch to This year
Click the tile’s name, This month, and pick This year. The tile then guesses the whole year. It adds the year so far to this month’s forecast. Each later day of the year gets this month’s daily average.This year stays gray until the year so far has loaded.
Every other line
Every other line
The forecast does the same for every line: units, orders, promo, ad spend, refunds, Amazon fees, and COGS.Say a full day’s gross profit is $7.00. The month’s gross profit is $7.00 × 31 = $217.00.No line on this tile wears est. The badge and the hover say the whole figure is a forecast.
Expenses in the forecast
Expenses in the forecast
Your expenses aren’t guessed. Only real charges dated inside the month count.Say you recorded $8.00 on October 2. Net profit is $217.00 - $8.00 = $209.00. A charge dated October 20 sits in this tile too, but not in Month to date, because that stops today.
Early in the month
Early in the month
Before the month has 2 full days, the forecast uses last month’s daily average.Ad spend is guessed only when this month has an ad figure, and the days the average comes from have one too. If not, it stays a dash.
Storage
Storage
Amazon bills a month’s storage after the month ends. So the forecast uses your latest storage bill for each day.Say that bill is $30.00 for a 30-day month. That’s $1.00 a day. October has 31 days, so the forecast puts -$31.00 of storage on Store fees (no product). Product rows carry none of it.
The chart and the chips
The chart and the chips
On the chart, your full days stay real bars. The days left are hollow Forecast bars, each one the average day. So today’s forecast bar is the average day, not today’s real sales. The Today tile is the real day.The chips under the tiles use real units, not guessed ones. On This month they use month to date. On This year they use the year so far.