> ## Documentation Index
> Fetch the complete documentation index at: https://docs.sourcedock.io/llms.txt
> Use this file to discover all available pages before exploring further.
# Capital Recovery
> See how much of the money you spent on stock has come back from Amazon, product by product.
Capital Recovery answers one question. How much of the money you put into stock has come back?
Each purchase you record becomes a **batch**. A batch is one lot of one product. SourceDock pulls your sales, fees, refunds, and reimbursements from Amazon. It matches them to each batch. Then it shows what you put in, what came back, and what is still on the shelf.
 You need a connected Amazon seller account. If your plan does not include Capital Recovery, the page shows an upgrade notice.
## The header
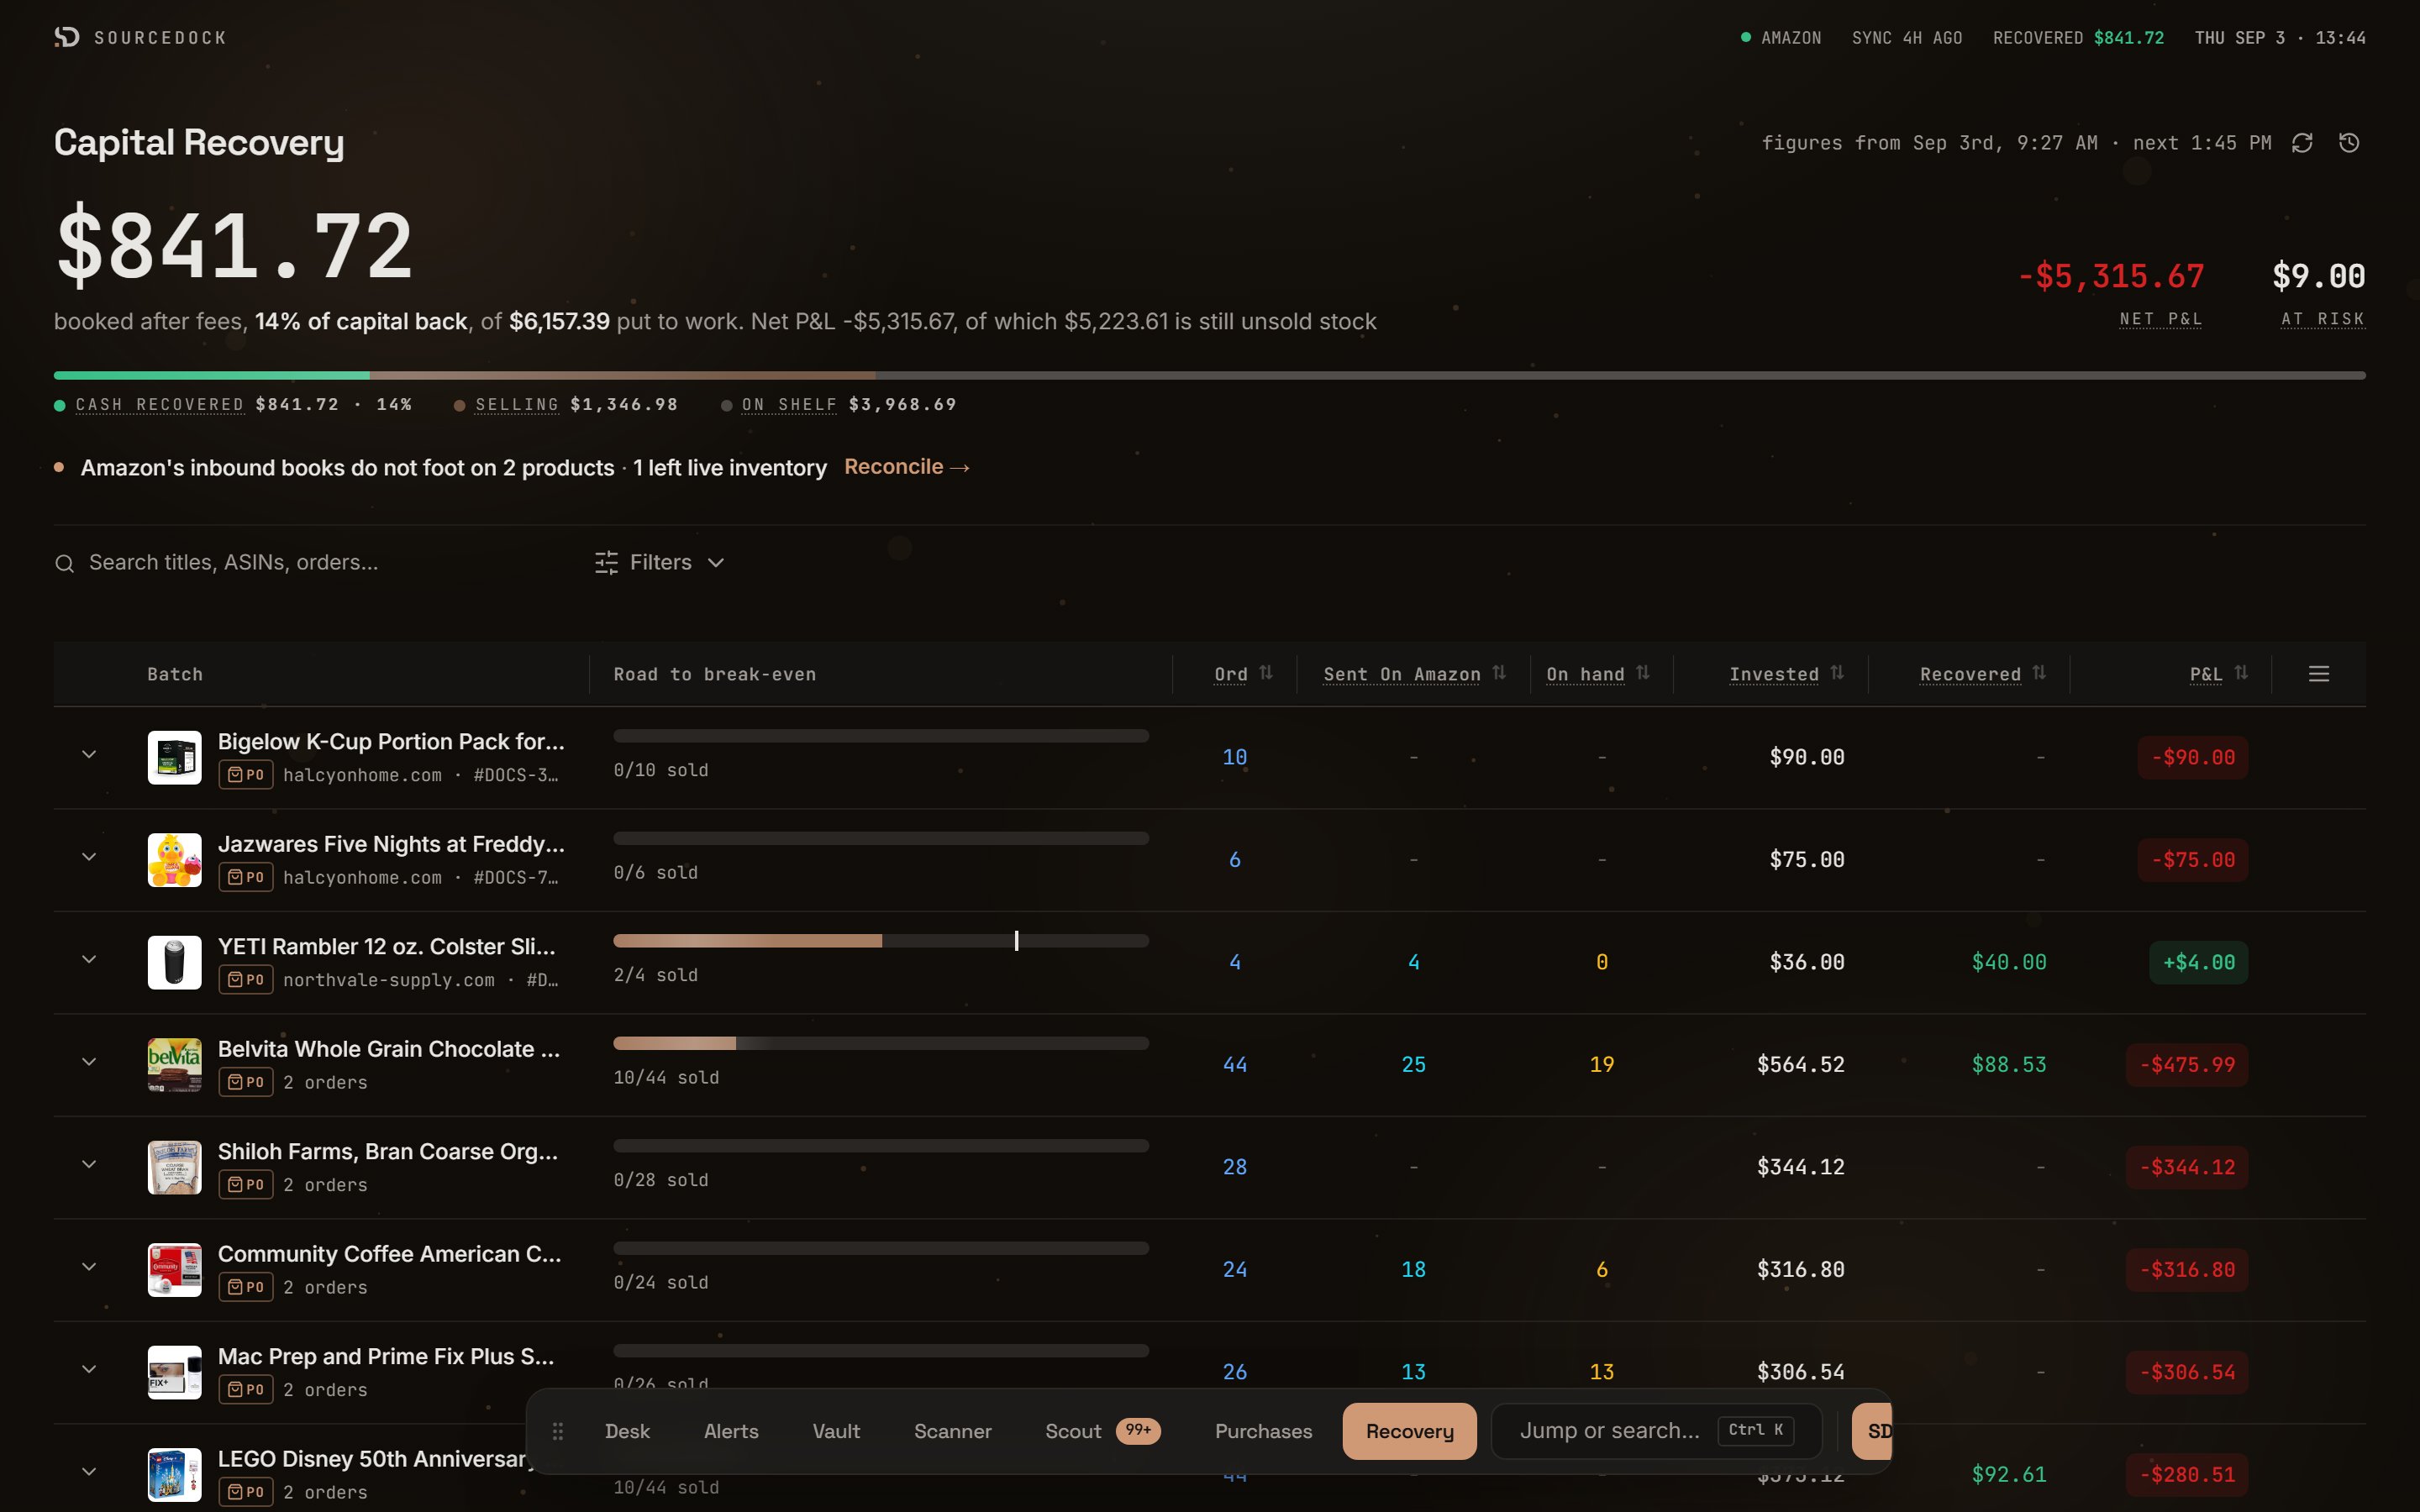
The big number is **recovered**. That is the cash Amazon has booked for you after fees, plus reimbursements. It is not profit. The line under it says what percent of your capital is back, and how much you put to work. It also shows **Net P\&L** and how much of that is still unsold stock.
| Figure | What it means |
| ------------ | ------------------------------------------------------------------------------------------------------------------------- |
| **Net P\&L** | Recovered minus what you put to work. It is often deeply negative while stock is unsold. That is normal, not a real loss. |
| **At risk** | The cost of units Amazon lost or damaged and has not paid you for yet. |
Under the figures is a thin bar with three bands. Hover any label to read what it means.
| Band | What it means |
| ------------------ | ---------------------------------------------------------------------------- |
| **Cash recovered** | Money already back, including payouts still in Amazon's 7 to 14 day reserve. |
| **Selling** | Money in products that have started selling but have not paid back in full. |
| **On shelf** | Money in batches with zero sales so far. |
You need a connected Amazon seller account. If your plan does not include Capital Recovery, the page shows an upgrade notice.
## The header
The big number is **recovered**. That is the cash Amazon has booked for you after fees, plus reimbursements. It is not profit. The line under it says what percent of your capital is back, and how much you put to work. It also shows **Net P\&L** and how much of that is still unsold stock.
| Figure | What it means |
| ------------ | ------------------------------------------------------------------------------------------------------------------------- |
| **Net P\&L** | Recovered minus what you put to work. It is often deeply negative while stock is unsold. That is normal, not a real loss. |
| **At risk** | The cost of units Amazon lost or damaged and has not paid you for yet. |
Under the figures is a thin bar with three bands. Hover any label to read what it means.
| Band | What it means |
| ------------------ | ---------------------------------------------------------------------------- |
| **Cash recovered** | Money already back, including payouts still in Amazon's 7 to 14 day reserve. |
| **Selling** | Money in products that have started selling but have not paid back in full. |
| **On shelf** | Money in batches with zero sales so far. |
 ### Sync stamp, refresh, and rebuild
The top right shows "figures from" a date and time. While a sync runs it says "updating". It may also show when the next scheduled sync is due. If the last sync failed, or is more than 7 days old, a **retry sync** link appears.
| Control | What it does |
| ----------------------------------- | ---------------------------------------------------------------------------------------------------------------------------------------------------------------------------------------------- |
| Refresh icon | Starts a new sync that pulls fresh data from Amazon. You can run it again after 60 seconds. A toast says "Sync started". If the data is fresh, it says "Data is already current". |
| History icon (**Rebuild all data**) | Wipes every Recovery figure and rebuilds it from the last 365 days. Rows show zero until it finishes. A dialog asks you to confirm. Use it only when a normal sync does not fix wrong numbers. |
| **Run First Sync** | Sits on a banner before your first sync: "Recovery has not checked Amazon yet." If no seller is connected, the banner offers **Connect Amazon** instead. |
While a sync runs, a progress line shows the phase and step count. A sync pulls fee analytics, settlement reports, sales and fees, inventory changes, customer returns, and reimbursements. Then it checks each batch and adds up the totals again. It can take several minutes.
## The table
Each row is one product across all its batches. Click a header to sort. Hover a header to read its meaning.
| Column | What it shows |
| ------------------ | ------------------------------------------------------------------------------------------------------------------------------------------------ |
| Batch | The product, with a link to its purchase orders. |
| Road to break-even | A bar. The filled part is units sold toward break-even. The tick is the unit where your money is back. Under it, units sold out of units bought. |
| Ord | Units you bought, across every batch of this product. |
| Sent On Amazon | What Amazon recorded as shipped inbound. A dash means SourceDock did not find those shipments. |
| On hand | Units bought minus Sent On Amazon, shown only when the inbound count is known. |
| Invested | What you paid for this product, all batches. |
| Recovered | Amazon payout after fees for this product. |
| P\&L | Net P\&L for this product. Break-even is when this is \$0 or better. |
**Simple** is the default density. **Advanced** adds two Amazon columns. **Marked Sent** is units on orders you marked Sent to FBA, minus write-offs. **Amazon Received** is what Amazon counted at the dock. You can also turn on **Amazon holds**: every unit that has gone through Amazon. That counts live stock plus units already sold, lost, or damaged.
### Filters
The search box finds titles, ASINs, and orders. Open the filter panel for more.
| Filter | Options |
| ------------- | ------------------------------------------------------------------------------------------------ |
| **Batches** | **All** or **Still recovering**. Still recovering shows products with at least one open lot. |
| **Purchased** | Date pills for All time, Last 30d, Last 90d, This month, and Last month, plus from and to dates. |
| **Table** | Simple or Advanced. |
When you click through from the At risk figure, an **Unreimbursed only** chip appears. Click its X to clear it.
## Expand a row
Click a row to open it.
### Sync stamp, refresh, and rebuild
The top right shows "figures from" a date and time. While a sync runs it says "updating". It may also show when the next scheduled sync is due. If the last sync failed, or is more than 7 days old, a **retry sync** link appears.
| Control | What it does |
| ----------------------------------- | ---------------------------------------------------------------------------------------------------------------------------------------------------------------------------------------------- |
| Refresh icon | Starts a new sync that pulls fresh data from Amazon. You can run it again after 60 seconds. A toast says "Sync started". If the data is fresh, it says "Data is already current". |
| History icon (**Rebuild all data**) | Wipes every Recovery figure and rebuilds it from the last 365 days. Rows show zero until it finishes. A dialog asks you to confirm. Use it only when a normal sync does not fix wrong numbers. |
| **Run First Sync** | Sits on a banner before your first sync: "Recovery has not checked Amazon yet." If no seller is connected, the banner offers **Connect Amazon** instead. |
While a sync runs, a progress line shows the phase and step count. A sync pulls fee analytics, settlement reports, sales and fees, inventory changes, customer returns, and reimbursements. Then it checks each batch and adds up the totals again. It can take several minutes.
## The table
Each row is one product across all its batches. Click a header to sort. Hover a header to read its meaning.
| Column | What it shows |
| ------------------ | ------------------------------------------------------------------------------------------------------------------------------------------------ |
| Batch | The product, with a link to its purchase orders. |
| Road to break-even | A bar. The filled part is units sold toward break-even. The tick is the unit where your money is back. Under it, units sold out of units bought. |
| Ord | Units you bought, across every batch of this product. |
| Sent On Amazon | What Amazon recorded as shipped inbound. A dash means SourceDock did not find those shipments. |
| On hand | Units bought minus Sent On Amazon, shown only when the inbound count is known. |
| Invested | What you paid for this product, all batches. |
| Recovered | Amazon payout after fees for this product. |
| P\&L | Net P\&L for this product. Break-even is when this is \$0 or better. |
**Simple** is the default density. **Advanced** adds two Amazon columns. **Marked Sent** is units on orders you marked Sent to FBA, minus write-offs. **Amazon Received** is what Amazon counted at the dock. You can also turn on **Amazon holds**: every unit that has gone through Amazon. That counts live stock plus units already sold, lost, or damaged.
### Filters
The search box finds titles, ASINs, and orders. Open the filter panel for more.
| Filter | Options |
| ------------- | ------------------------------------------------------------------------------------------------ |
| **Batches** | **All** or **Still recovering**. Still recovering shows products with at least one open lot. |
| **Purchased** | Date pills for All time, Last 30d, Last 90d, This month, and Last month, plus from and to dates. |
| **Table** | Simple or Advanced. |
When you click through from the At risk figure, an **Unreimbursed only** chip appears. Click its X to clear it.
## Expand a row
Click a row to open it.
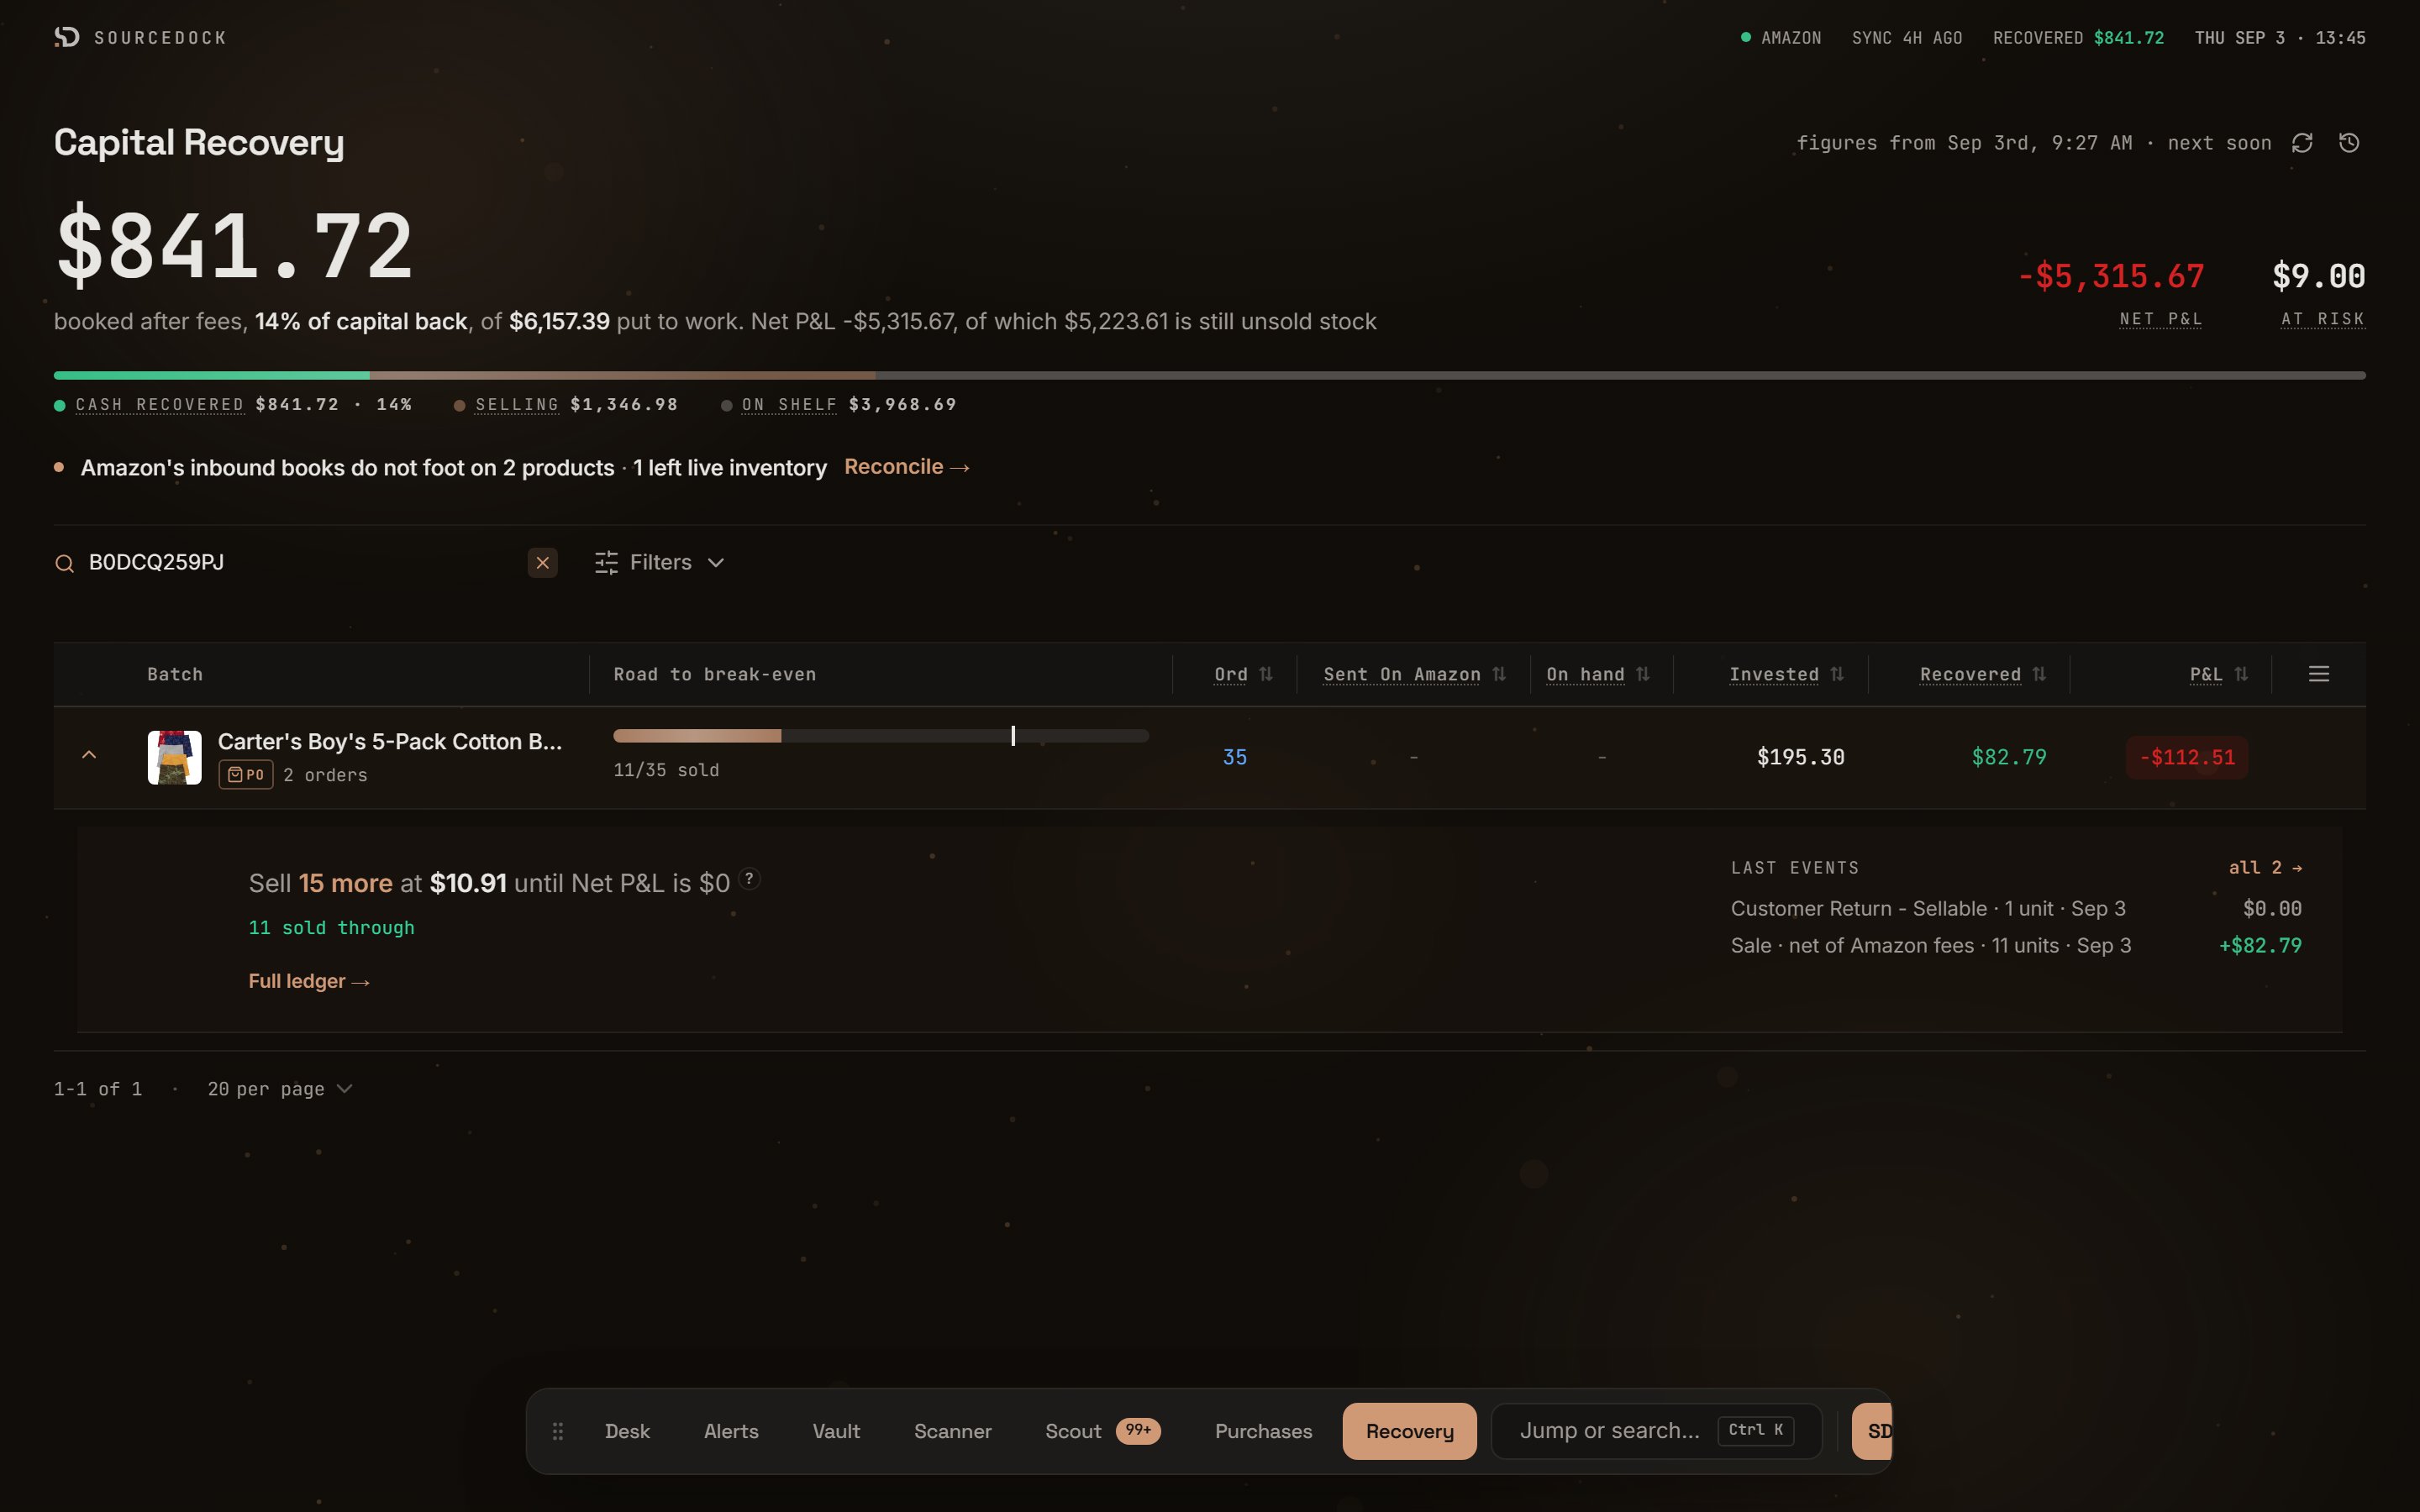 The left side starts with a sentence about break-even. Under it is the **at-Amazon line**. It says where the units are now: sold through, available, reserved for orders, preparing, receiving, unfulfillable, or in transit. Hover "reserved for orders" to see the split between customer orders, warehouse transfers, and processing. If Amazon has no record yet, it says "nothing at Amazon yet".
Refunds are listed with a total, if there are any. If Amazon's inbound counts do not match, an **Inbound discrepancy** badge appears with plain notes. See the [reconcile reference](/reference/reconcile).
The right side lists the latest Amazon events. If units were damaged or lost, it says so. A **Potential claim?** chip appears when you may be able to ask Amazon for money.
Click **Full ledger →** to open the ledger drawer.
## The ledger drawer
The drawer has two tabs: **LEDGER** and **EVENTS**. A date range menu sits beside them: **ALL TIME**, **LAST 30D**, or **LAST 90D**.
The left side starts with a sentence about break-even. Under it is the **at-Amazon line**. It says where the units are now: sold through, available, reserved for orders, preparing, receiving, unfulfillable, or in transit. Hover "reserved for orders" to see the split between customer orders, warehouse transfers, and processing. If Amazon has no record yet, it says "nothing at Amazon yet".
Refunds are listed with a total, if there are any. If Amazon's inbound counts do not match, an **Inbound discrepancy** badge appears with plain notes. See the [reconcile reference](/reference/reconcile).
The right side lists the latest Amazon events. If units were damaged or lost, it says so. A **Potential claim?** chip appears when you may be able to ask Amazon for money.
Click **Full ledger →** to open the ledger drawer.
## The ledger drawer
The drawer has two tabs: **LEDGER** and **EVENTS**. A date range menu sits beside them: **ALL TIME**, **LAST 30D**, or **LAST 90D**.
 ### The LEDGER tab
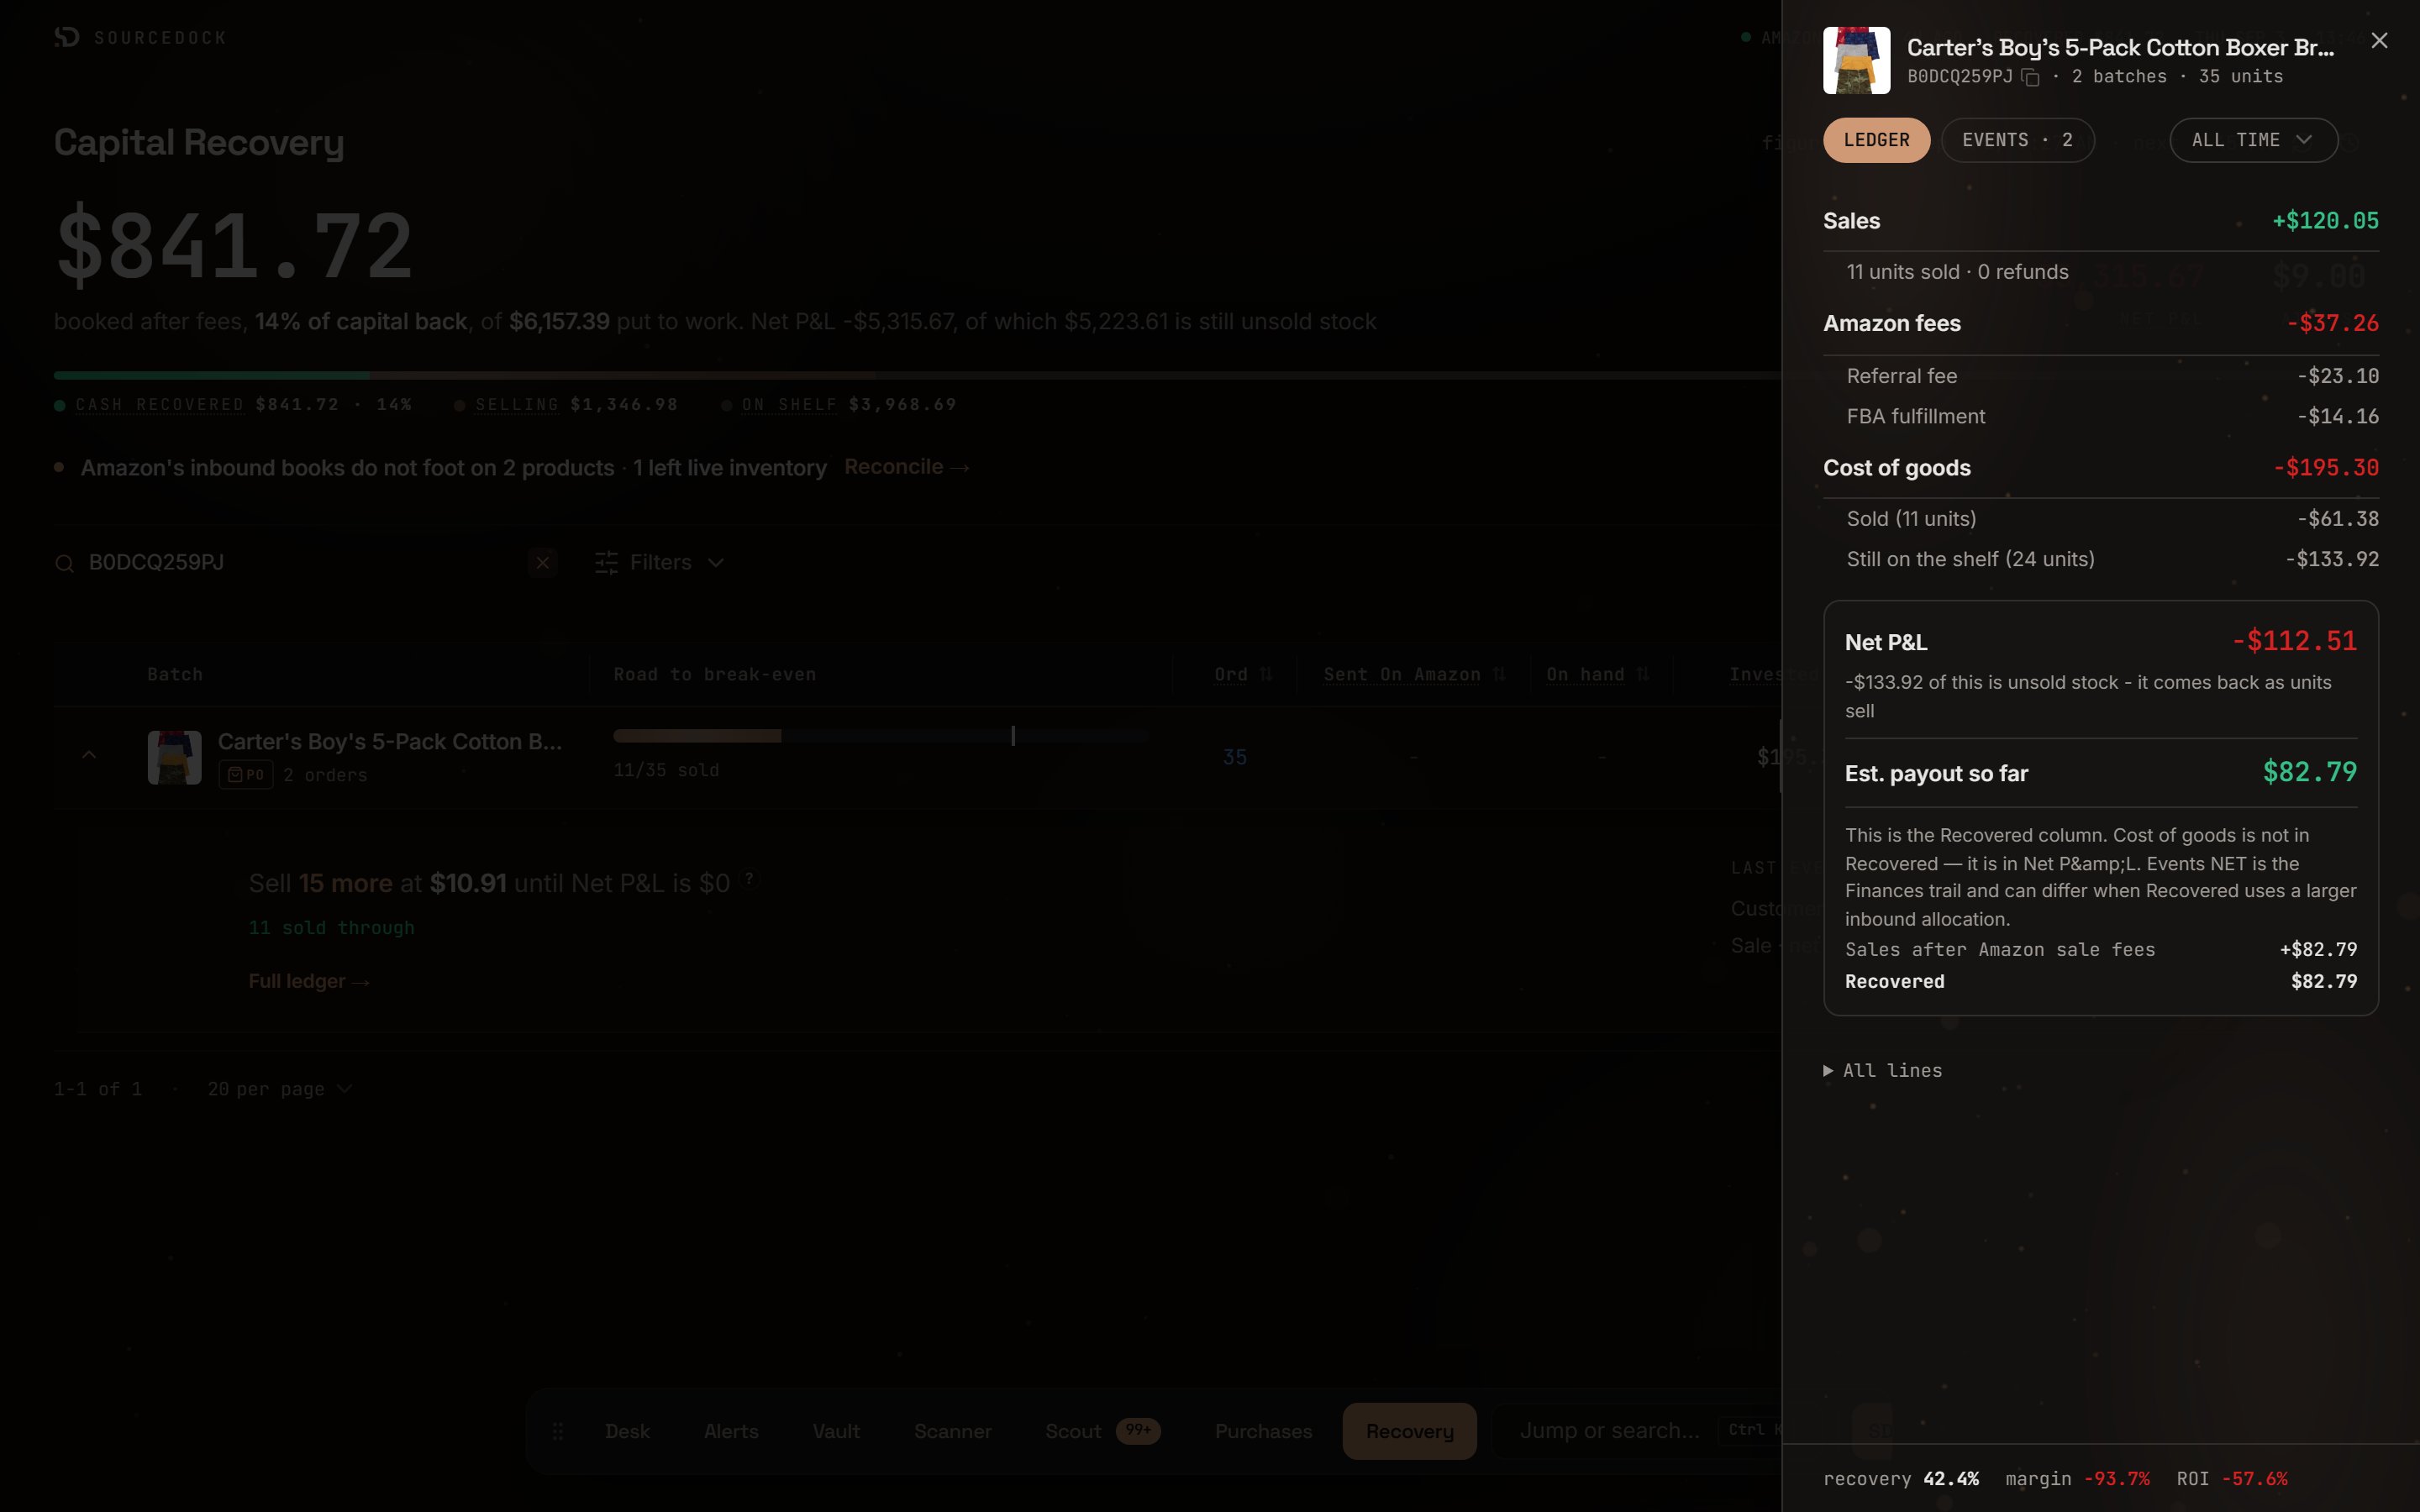
The ledger shows the money in four groups.
| Group | What is in it |
| ----------------- | ---------------------------------------------------------------------------------------------------------------------------- |
| **Sales** | Units sold and refunds. |
| **Amazon fees** | Referral fee, FBA fulfillment, inbound transportation, placement, storage, removal, and any reimbursements that offset them. |
| **Cost of goods** | Units sold, and units still on the shelf. |
| **Net P\&L** | The net figure, and the estimated payout so far. |
Under the payout is a short list that adds up to Recovered. Sales after Amazon sale fees, plus reimbursements, minus inbound, placement, and other service fees.
The footer shows three rates. **recovery** is recovered divided by invested. **margin** is Net P\&L divided by sales. **ROI** is Net P\&L divided by invested.
When you pick a date range, sales and fees are for that window only. Net P\&L stays all-time. The payout line reads "Est. payout this window".
### All lines and the Financial Breakdown
Click **All lines** at the bottom of the ledger. The full **Financial Breakdown** opens. This is the waterfall. It starts with sales and takes away each cost until it reaches net profit. Lines that are zero are hidden.
### The LEDGER tab
The ledger shows the money in four groups.
| Group | What is in it |
| ----------------- | ---------------------------------------------------------------------------------------------------------------------------- |
| **Sales** | Units sold and refunds. |
| **Amazon fees** | Referral fee, FBA fulfillment, inbound transportation, placement, storage, removal, and any reimbursements that offset them. |
| **Cost of goods** | Units sold, and units still on the shelf. |
| **Net P\&L** | The net figure, and the estimated payout so far. |
Under the payout is a short list that adds up to Recovered. Sales after Amazon sale fees, plus reimbursements, minus inbound, placement, and other service fees.
The footer shows three rates. **recovery** is recovered divided by invested. **margin** is Net P\&L divided by sales. **ROI** is Net P\&L divided by invested.
When you pick a date range, sales and fees are for that window only. Net P\&L stays all-time. The payout line reads "Est. payout this window".
### All lines and the Financial Breakdown
Click **All lines** at the bottom of the ledger. The full **Financial Breakdown** opens. This is the waterfall. It starts with sales and takes away each cost until it reaches net profit. Lines that are zero are hidden.
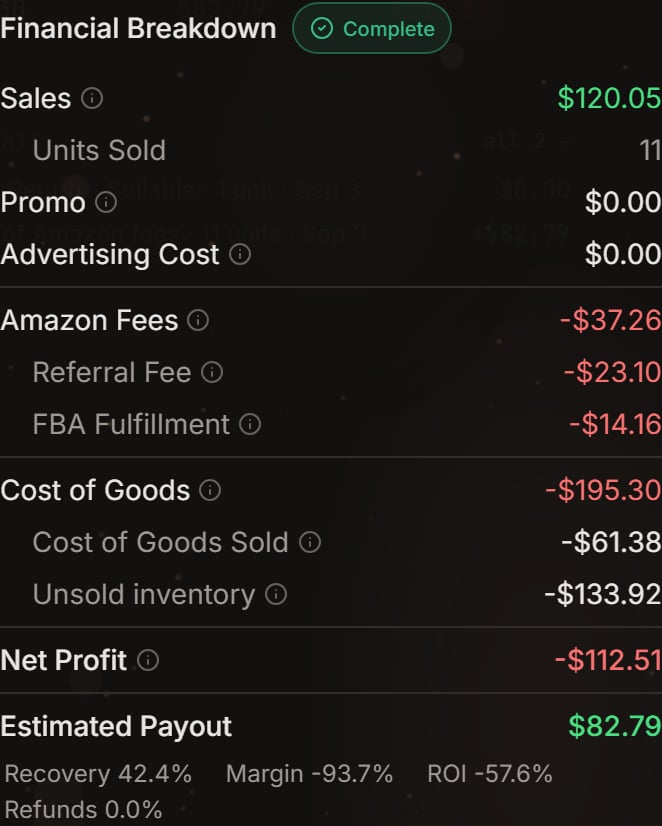 | Line | What it means |
| --------------------------- | -------------------------------------------------------------------------------------------------------------- |
| Sales | Money buyers paid for the product. Tax and shipping are not included. |
| Units Sold | How many units sold. |
| Refunds | How many units were refunded. |
| Promo | Discounts you funded, like coupons. |
| Advertising Cost | What you spent on Amazon ads for this product. |
| Amazon Fees | All Amazon fees added up, minus reimbursements. |
| Referral Fee | Amazon's cut of each sale. Often 8 to 15 percent. |
| FBA Fulfillment | Amazon's fee to pick, pack, and ship each unit. |
| FBA Weight | An extra weight fee, when charged. |
| Variable Closing | A closing fee on some categories. |
| Fixed Closing | A fixed fee on media items. |
| Digital Services | A fee on digital services, when charged. |
| Other Fees | Fees Amazon did not name. |
| Inbound Transportation | What Amazon charged to ship your goods to its warehouse. |
| FBA Inbound Convenience Fee | Amazon's placement fee for choosing where your goods go. |
| FBA Storage | Monthly fees for space in Amazon's warehouse. |
| Removal | Fees to remove or throw away units. |
| Reimbursements | Money Amazon paid you for lost or damaged units. |
| Reversal Reimbursement | A credit where Amazon undid an earlier reimbursement. |
| Refund Cost | What refunds cost you, after Amazon gave fees back. |
| Refunded Amount | Product price returned to buyers. |
| Refunded Fees | Fee credits Amazon returned to you on refunds. |
| Sellable Returns | The cost value of returned units that can be sold again. |
| Unreimbursed Losses | Lost or damaged units Amazon has not paid you for. |
| Cost of Goods | What you paid for every unit you bought. |
| Cost of Goods Sold | Units sold times cost per unit. |
| Lost / Damaged | Units Amazon lost or damaged times cost per unit. |
| Unsold inventory | Cost of units not yet sold, lost, or damaged. |
| Overhead | Shipping, tax, and discounts spread across the items. |
| Net Profit | Sales minus every cost above. Break-even is \$0 or better. |
| Estimated Payout | What Amazon actually deposits. Sales after fees, plus reimbursements and sellable returns, minus service fees. |
Under the lines are four rates: Recovery, Margin, ROI, and Refunds.
If a batch has no buy cost, the header says "Cost unknown". Net Profit then has no cost of goods in it. Record the buy cost to get a real margin.
### The data completeness badge
A small badge sits next to the Financial Breakdown title. It tells you how solid the figures are.
| Badge | What it means |
| --------------- | --------------------------------------------------------------------------------------------------------------------------------- |
| Complete | Every sold unit has its own Amazon event. The figures are the real charges Amazon posted. |
| Partial | Some units have no event yet. It shows how many do, like "3 of 7 units". Sales and fees for the rest use Amazon's monthly totals. |
| Estimated | No events yet. Sales and fees come from Amazon's monthly totals. They firm up on later syncs. |
| Incomplete sync | The last sync did not get all the data. Treat the figures as a floor and run the sync again. |
Why can events be missing? Amazon files events by the date money moved, not the order date. Old sales may have posted before your first sync reached back that far. A date-filtered view always shows Complete. It is built only from events.
| Line | What it means |
| --------------------------- | -------------------------------------------------------------------------------------------------------------- |
| Sales | Money buyers paid for the product. Tax and shipping are not included. |
| Units Sold | How many units sold. |
| Refunds | How many units were refunded. |
| Promo | Discounts you funded, like coupons. |
| Advertising Cost | What you spent on Amazon ads for this product. |
| Amazon Fees | All Amazon fees added up, minus reimbursements. |
| Referral Fee | Amazon's cut of each sale. Often 8 to 15 percent. |
| FBA Fulfillment | Amazon's fee to pick, pack, and ship each unit. |
| FBA Weight | An extra weight fee, when charged. |
| Variable Closing | A closing fee on some categories. |
| Fixed Closing | A fixed fee on media items. |
| Digital Services | A fee on digital services, when charged. |
| Other Fees | Fees Amazon did not name. |
| Inbound Transportation | What Amazon charged to ship your goods to its warehouse. |
| FBA Inbound Convenience Fee | Amazon's placement fee for choosing where your goods go. |
| FBA Storage | Monthly fees for space in Amazon's warehouse. |
| Removal | Fees to remove or throw away units. |
| Reimbursements | Money Amazon paid you for lost or damaged units. |
| Reversal Reimbursement | A credit where Amazon undid an earlier reimbursement. |
| Refund Cost | What refunds cost you, after Amazon gave fees back. |
| Refunded Amount | Product price returned to buyers. |
| Refunded Fees | Fee credits Amazon returned to you on refunds. |
| Sellable Returns | The cost value of returned units that can be sold again. |
| Unreimbursed Losses | Lost or damaged units Amazon has not paid you for. |
| Cost of Goods | What you paid for every unit you bought. |
| Cost of Goods Sold | Units sold times cost per unit. |
| Lost / Damaged | Units Amazon lost or damaged times cost per unit. |
| Unsold inventory | Cost of units not yet sold, lost, or damaged. |
| Overhead | Shipping, tax, and discounts spread across the items. |
| Net Profit | Sales minus every cost above. Break-even is \$0 or better. |
| Estimated Payout | What Amazon actually deposits. Sales after fees, plus reimbursements and sellable returns, minus service fees. |
Under the lines are four rates: Recovery, Margin, ROI, and Refunds.
If a batch has no buy cost, the header says "Cost unknown". Net Profit then has no cost of goods in it. Record the buy cost to get a real margin.
### The data completeness badge
A small badge sits next to the Financial Breakdown title. It tells you how solid the figures are.
| Badge | What it means |
| --------------- | --------------------------------------------------------------------------------------------------------------------------------- |
| Complete | Every sold unit has its own Amazon event. The figures are the real charges Amazon posted. |
| Partial | Some units have no event yet. It shows how many do, like "3 of 7 units". Sales and fees for the rest use Amazon's monthly totals. |
| Estimated | No events yet. Sales and fees come from Amazon's monthly totals. They firm up on later syncs. |
| Incomplete sync | The last sync did not get all the data. Treat the figures as a floor and run the sync again. |
Why can events be missing? Amazon files events by the date money moved, not the order date. Old sales may have posted before your first sync reached back that far. A date-filtered view always shows Complete. It is built only from events.
 ### The EVENTS tab
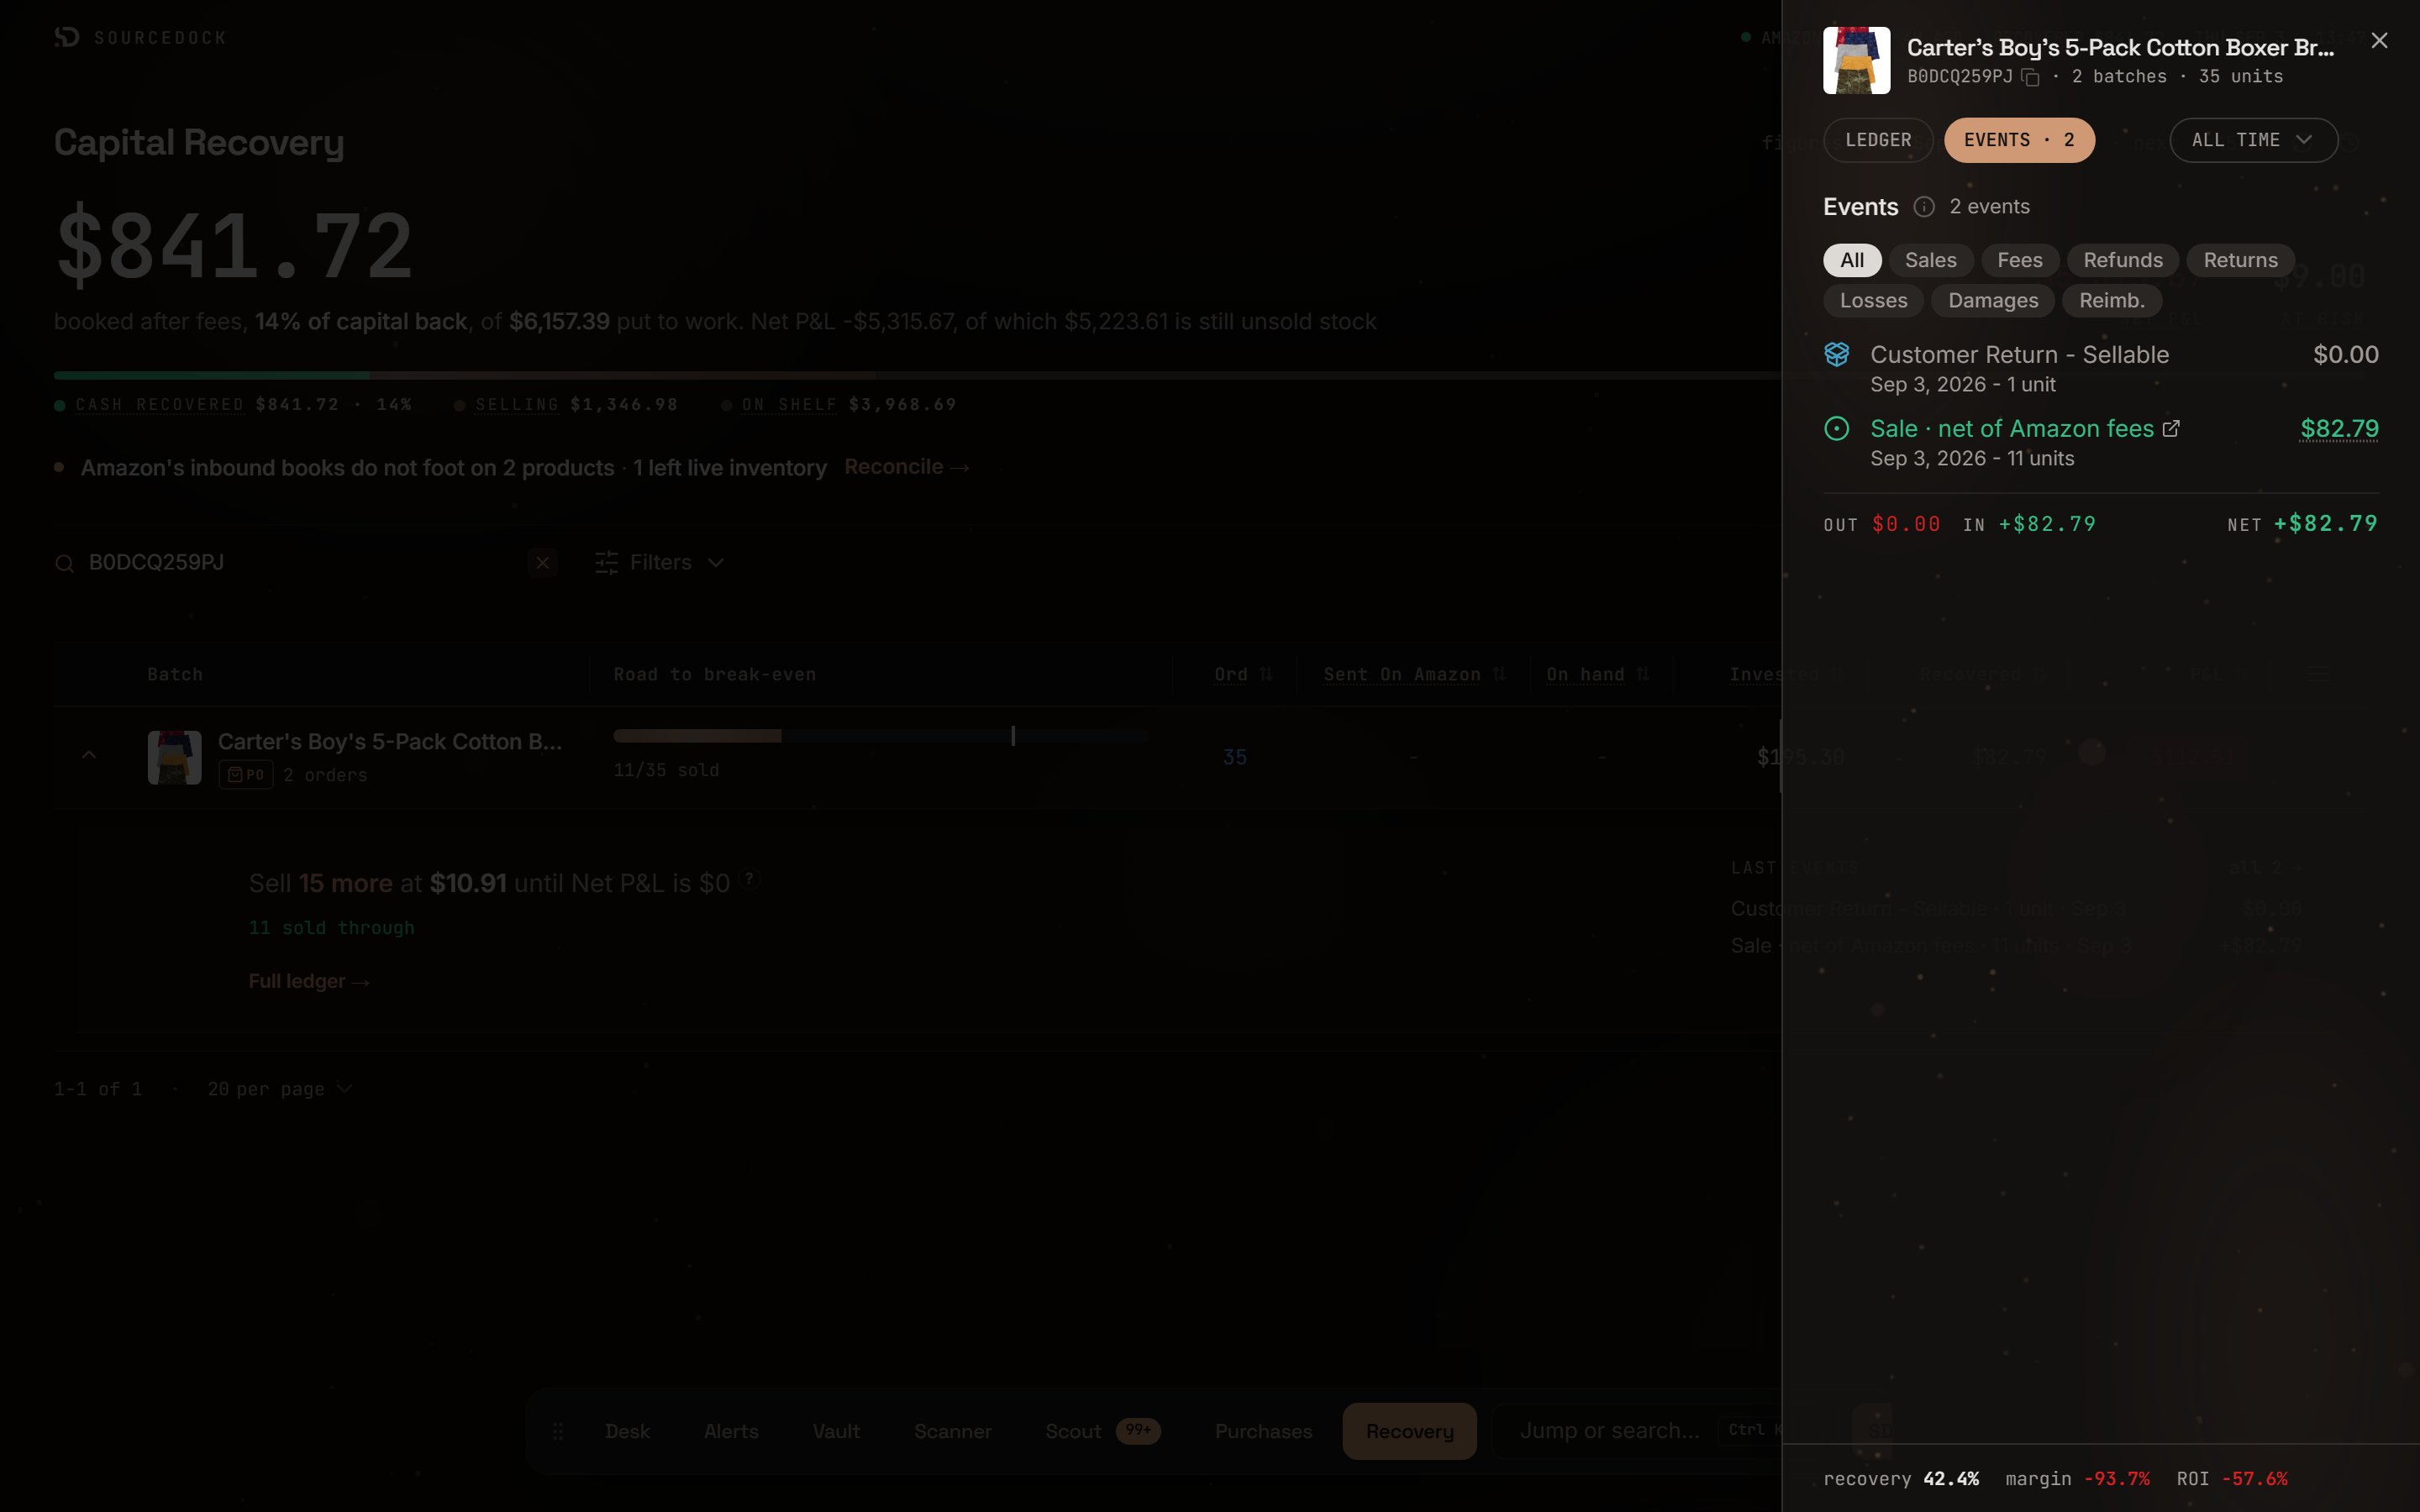
This tab lists every Amazon event for the product. Pills filter by type: **All**, **Sales**, **Fees**, **Refunds**, **Returns**, **Losses**, **Damages**, and **Reimb.** for reimbursements. Sale amounts are what you got after fees, not the sale price. The bottom shows money **Out**, money **In**, and the **Net**.
### The EVENTS tab
This tab lists every Amazon event for the product. Pills filter by type: **All**, **Sales**, **Fees**, **Refunds**, **Returns**, **Losses**, **Damages**, and **Reimb.** for reimbursements. Sale amounts are what you got after fees, not the sale price. The bottom shows money **Out**, money **In**, and the **Net**.
 ## The review drawer
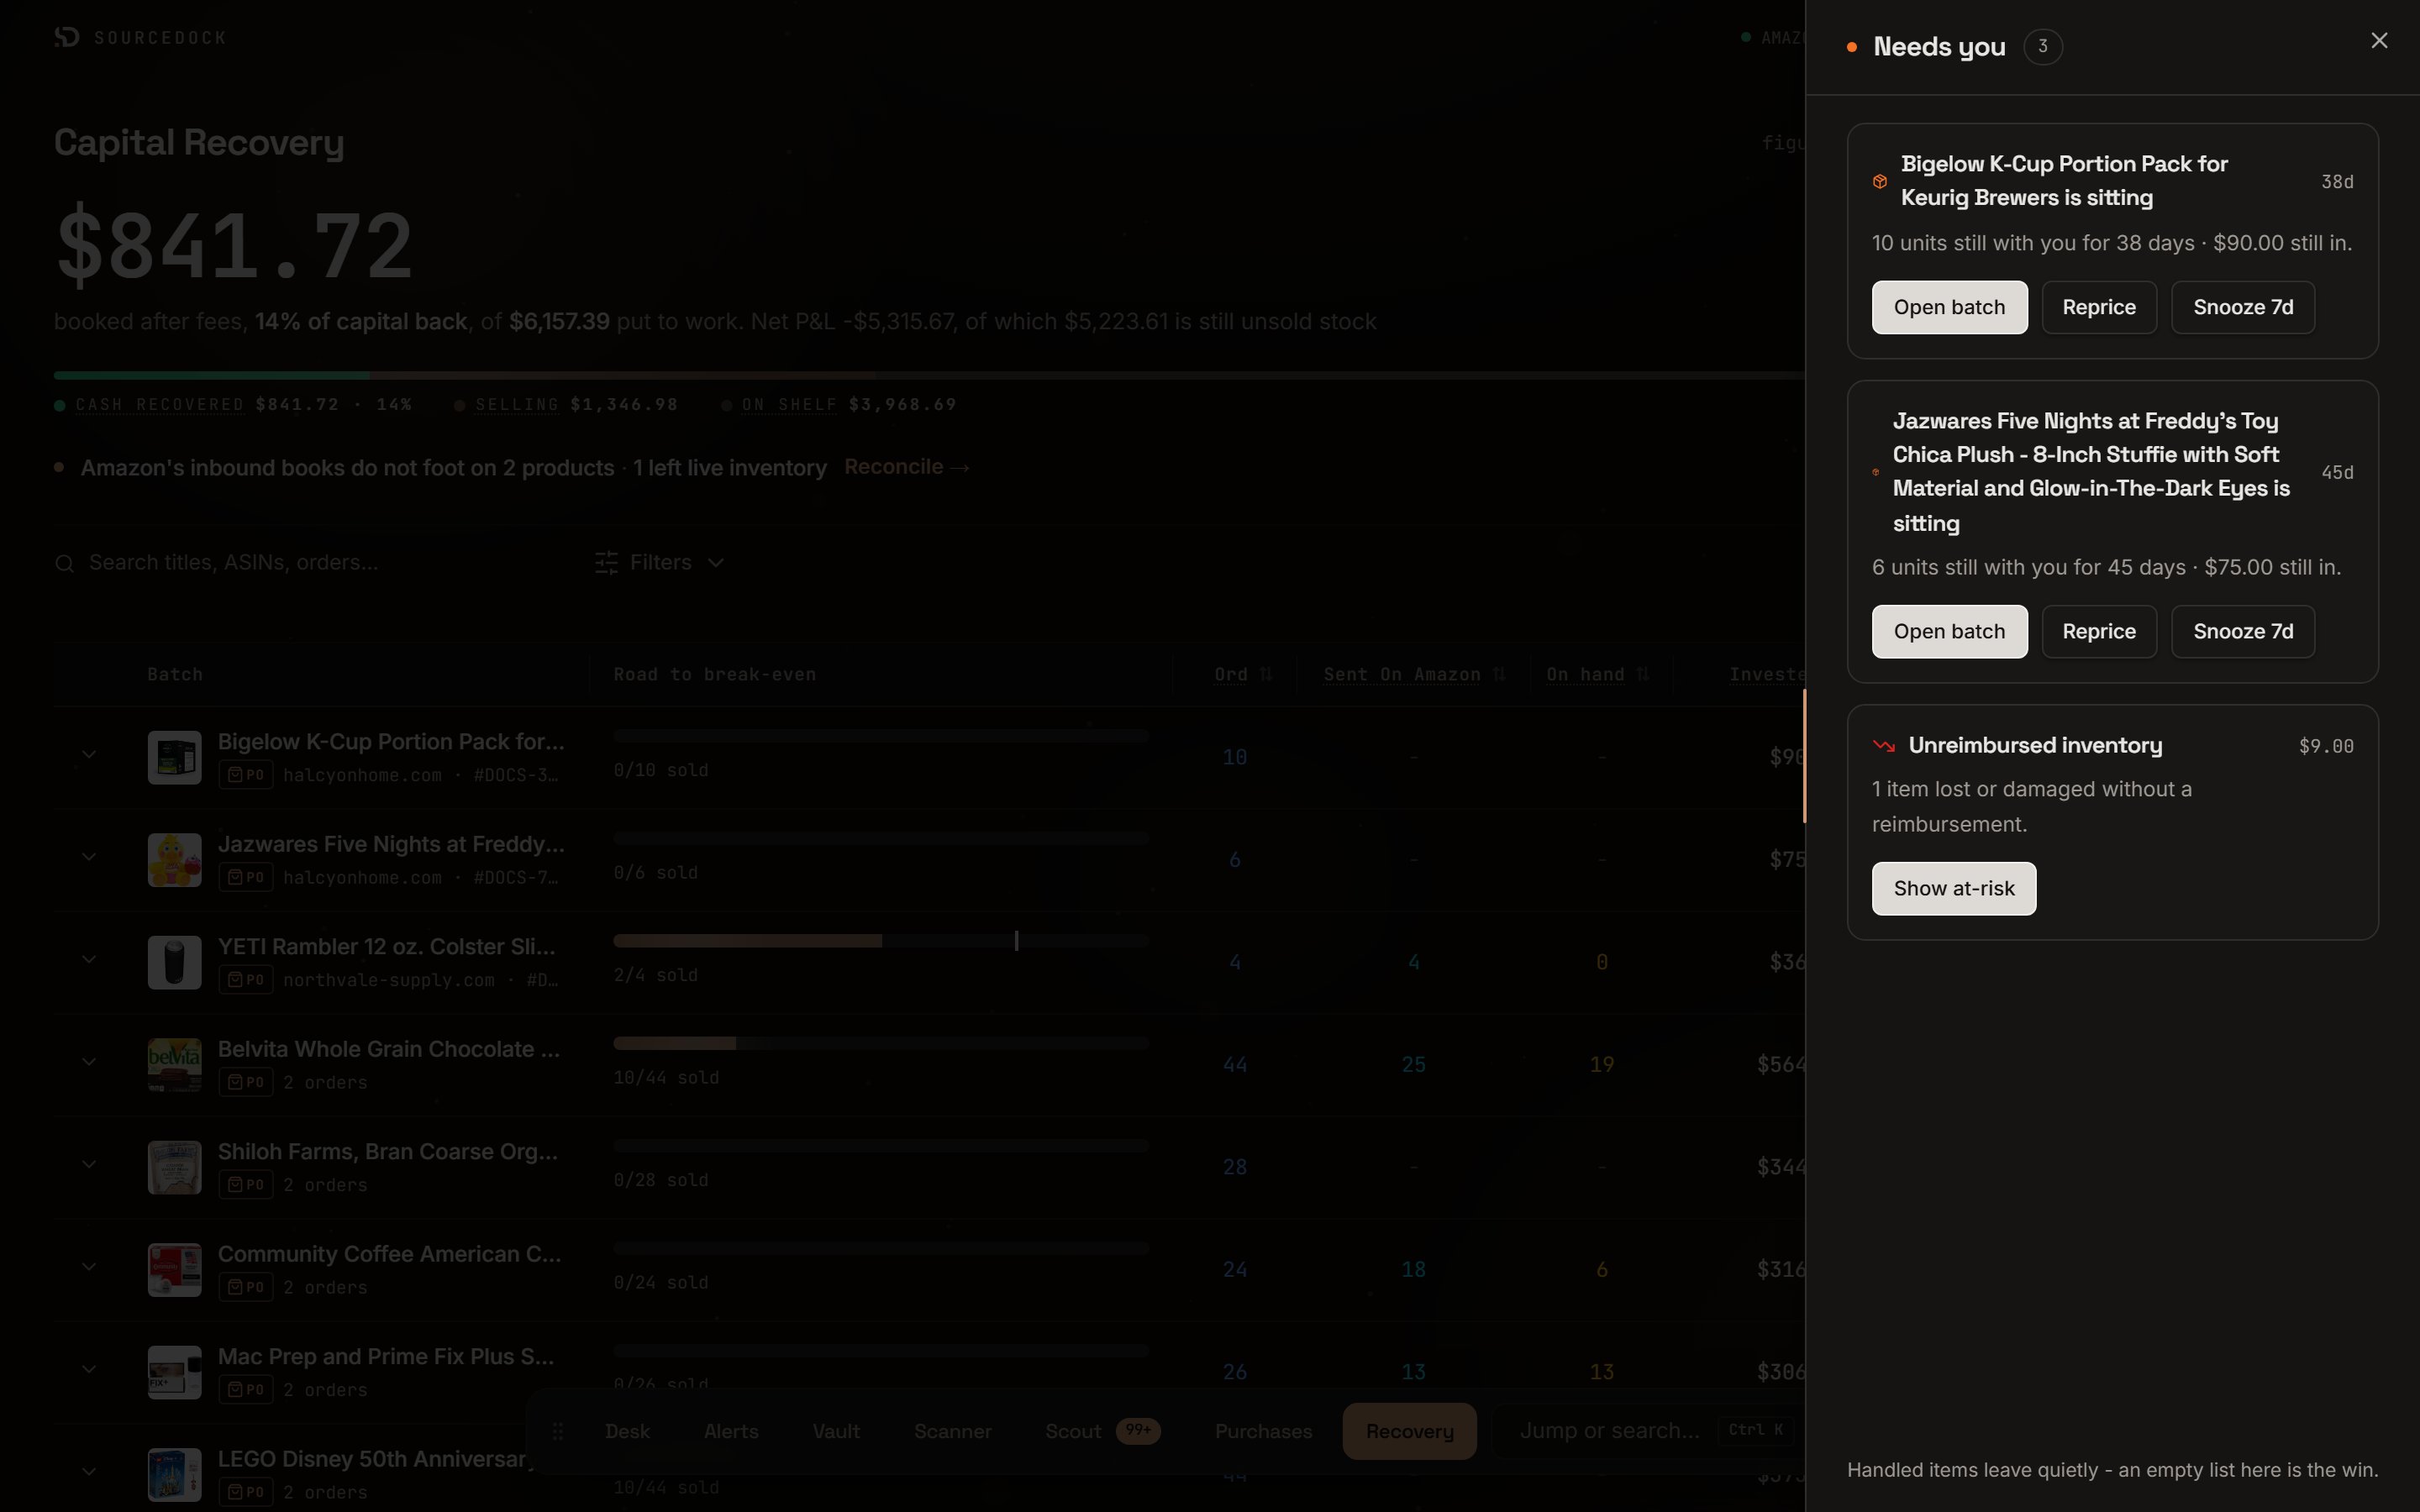
Open the page with `?alerts=1` to see the **Needs you** drawer. It lists things to act on. Click **Snooze 7d** to hide an item for a week.
| Item | What it means |
| ----------------------------- | ------------------------------------------------------------------------------ |
| A product that is **sitting** | Units on hand for a long time, with the cash tied up. |
| A product that **is asleep** | No first sale after many days. Click **Reprice** to open it in Seller Central. |
| A product with slow **pace** | Break-even is far off at the current rate. |
| A stale sync | Click **Retry sync**. |
| **Unreimbursed inventory** | Units lost or damaged with no payment. Click **Show at-risk**. |
## The review drawer
Open the page with `?alerts=1` to see the **Needs you** drawer. It lists things to act on. Click **Snooze 7d** to hide an item for a week.
| Item | What it means |
| ----------------------------- | ------------------------------------------------------------------------------ |
| A product that is **sitting** | Units on hand for a long time, with the cash tied up. |
| A product that **is asleep** | No first sale after many days. Click **Reprice** to open it in Seller Central. |
| A product with slow **pace** | Break-even is far off at the current rate. |
| A stale sync | Click **Retry sync**. |
| **Unreimbursed inventory** | Units lost or damaged with no payment. Click **Show at-risk**. |
 ## Reconcile
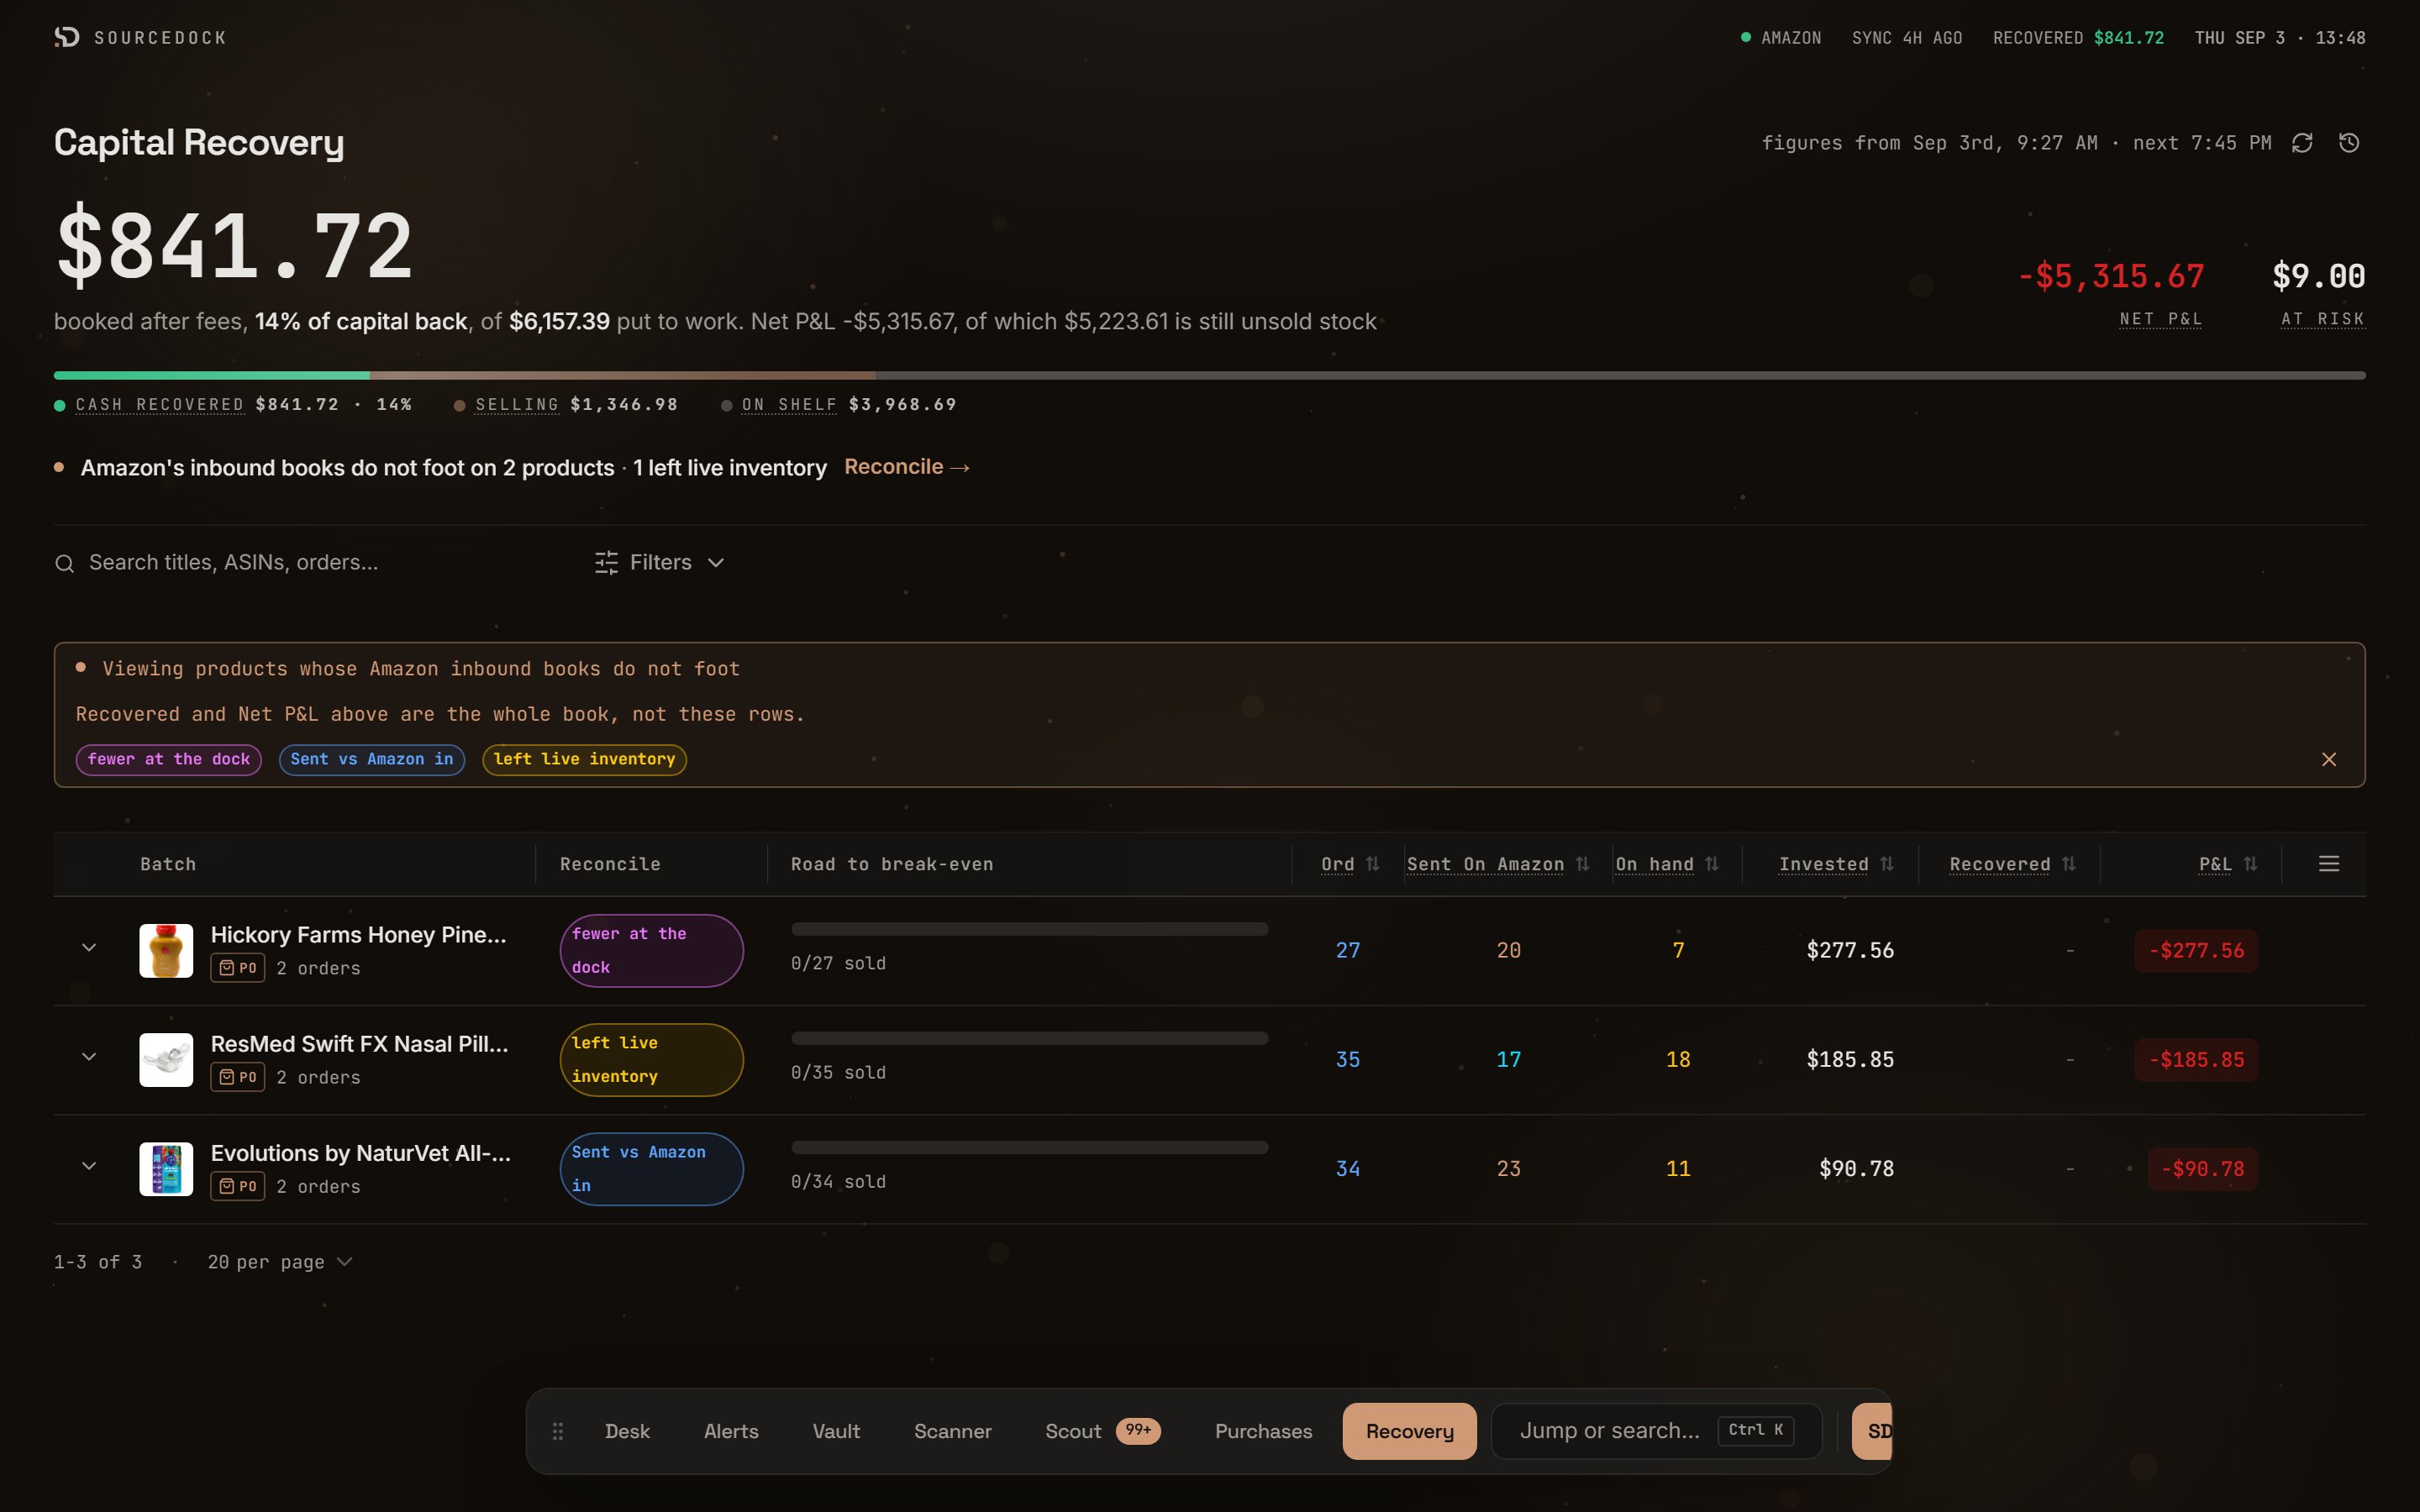
When Amazon's inbound counts do not match yours, a line appears under the header. Click **Reconcile →** to see only those products. The [reconcile reference](/reference/reconcile) explains each message and what to do.
## Reconcile
When Amazon's inbound counts do not match yours, a line appears under the header. Click **Reconcile →** to see only those products. The [reconcile reference](/reference/reconcile) explains each message and what to do.